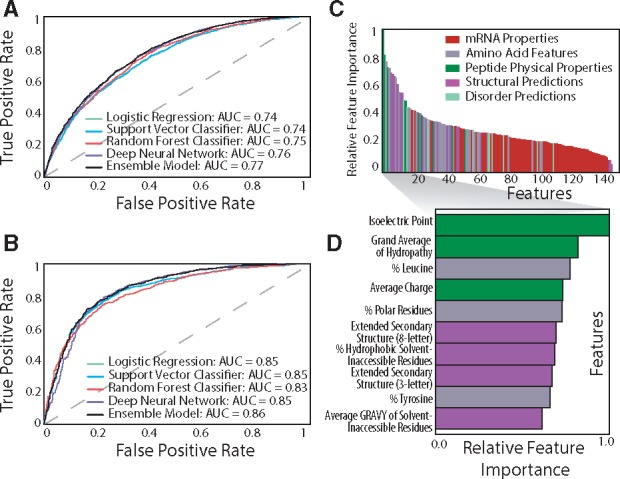
Fig. 4.

Result of machine learning workflow. Receiver Operating Curve (ROC) of the machine learning model for (A) expression data and (B) solubility data displaying the trade-off between the True Positive Rate and False Positive Rate. (C) Relative importance of protein features for the expression data, colored by property class. (D) Identities and relative feature importance of the top 10 features (Color version of this figure is available at Bioinformatics online.)
