Fig. 5.

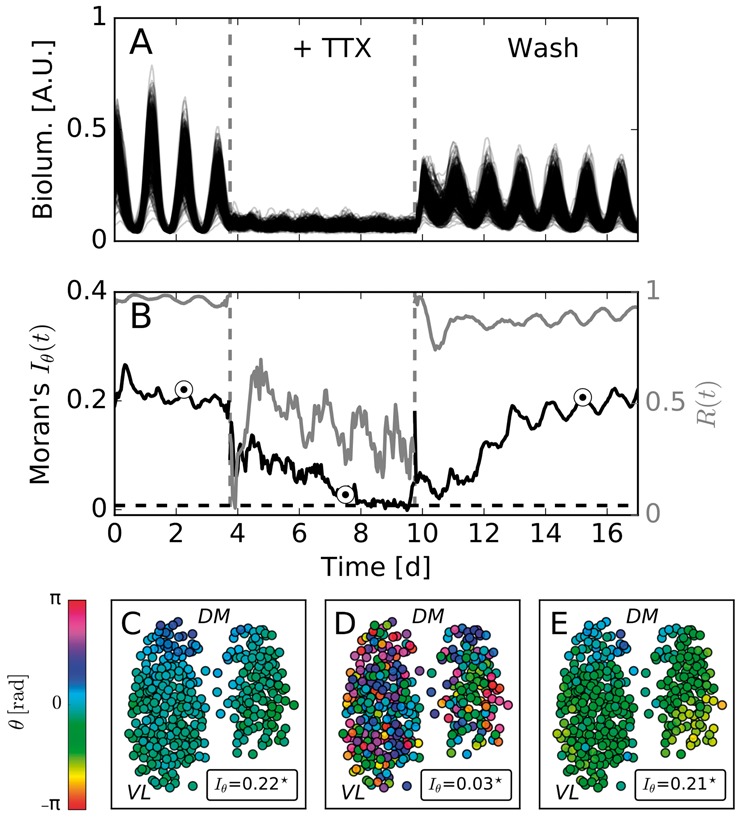
Suspension of synaptic couplings decreases the degree of spatial order in clock gene expression dynamics: (A) Bioluminescence time series. (B) Moran’s index (bold black line) and mean-field phase coherence R(t) (bold gray line) for the time series plotted in the panel (A). (C–E) Color coded instantaneous phases estimated by means of a Hilbert transform. Plotted phase distributions correspond to the time instances depicted by circles in the panel (B). Stars denote statistically significant deviations from the null hypothesis of no spatial autocorrelation. The abbreviations DM and VL indicate rough positions of the dorso-medial and ventro-lateral regions of the SCN, respectively. The dashed black line in (B) corresponds to the upper critical value of , as described in Figure 4. The corresponding sampling distribution is depicted in Supplementary Figure S5
