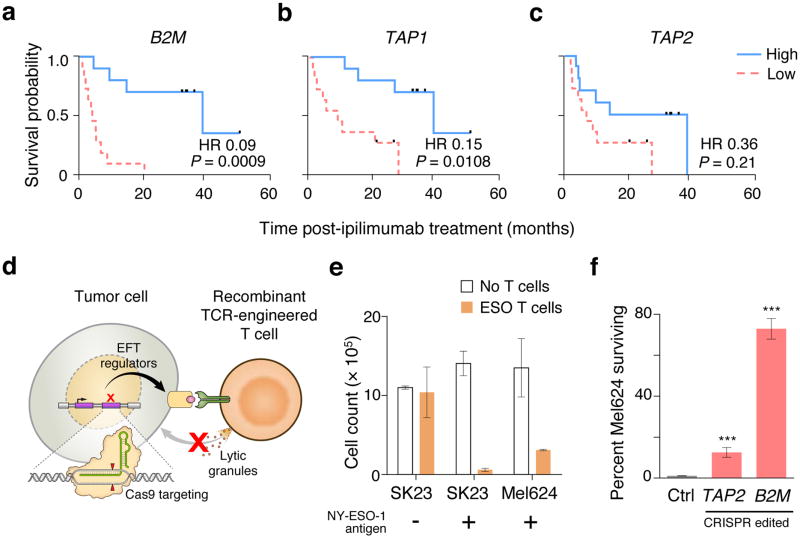
Figure 1. 2CT-CRISPR assay system confirms functional essentiality of antigen presentation genes for immunotherapy.
a–c, Kaplan-Meier survival plots of patient overall survival with the expression of antigen presentation genes B2M (a), TAP1 (b) and TAP2 (c) after ipilimumab immunotherapy. Patients were categorized into ‘High’ and ‘Low’ groups according to the highest and the lowest quartiles of each individual gene expression (RPKM). Reported P-values have been penalized by multiplying the unadjusted P-value by 3 to account for the comparison of the two extreme quartiles. Hazard ratio (HR) was calculated using Mantel-Haenszel test; with HR ranges: B2M (0.02–0.31), TAP1 (0.04–0.52) and TAP2 (0.12–1.07). Data is derived from 42 melanoma patients from the Van-Allen et al. cohort3. d, Schematic of the 2CT-CRISPR assay to identify essential genes for EFT. e, NY-ESO-1 antigen specific lysis of melanoma cells after 24 h of co-culture of ESO T cells with NY-ESO-1− SK23, NY-ESO-1+ SK23 and NY-ESO-1+ Mel624 cells (n = 3 biological replicates) at E:T ratio of 1. f, Survival of Mel624 cells modified through lentiviral CRISPR targeting of MHC class I antigen presentation/processing genes after introduction of ESO T cells. CRISPR-modified Mel624 cells were co-cultured with ESO T cells at E:T ratio of 0.5 for 12 h. Live cell survival (%) was calculated from control cells unexposed to T cell selection. Data is from 3 independent infection replicates. All values are mean ± s.e.m. ***P < 0.001 as determined by Student’s t-test.

