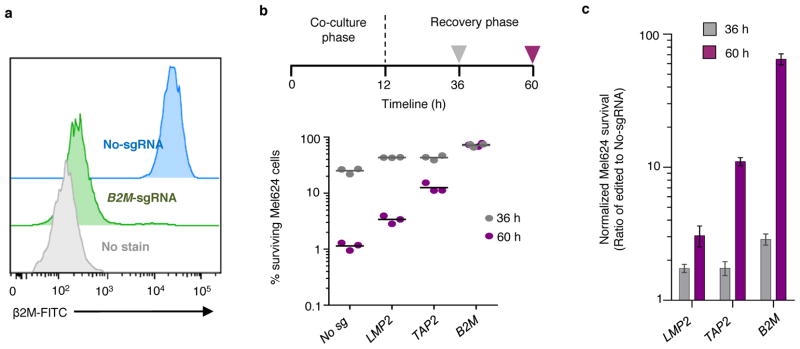
Extended Data Figure 3. Optimization of 2CT-CRISPR assay system for genome-scale screening.
a, Representative FACS plot of B2M expression in Mel624 cells on day 5 after transduction with lentiCRISPRv2 lentivirus containing a pool of three sgRNAs targeting B2M. b–c, Cas9 disruption of MHC Class I antigen presentation/processing pathway genes reduces efficacy of T cell-mediated cytolysis. Timeline shows 12 hours of co-culture of ESO T cells with individual gene edited Mel624 cells at E:T ratio of 0.5. Live cell survival (%) was calculated from control cells unexposed to T cell selection. Each dot in the plot represents independent gene-specific CRISPR lentivirus infection replicate (n = 3). Improvement in CRISPR edited cell yields at 60 h timepoint compared to 36 h after 2CT assay as shown in (c). All values are mean ± s.e.m. Data is representative of two independent experiments.

