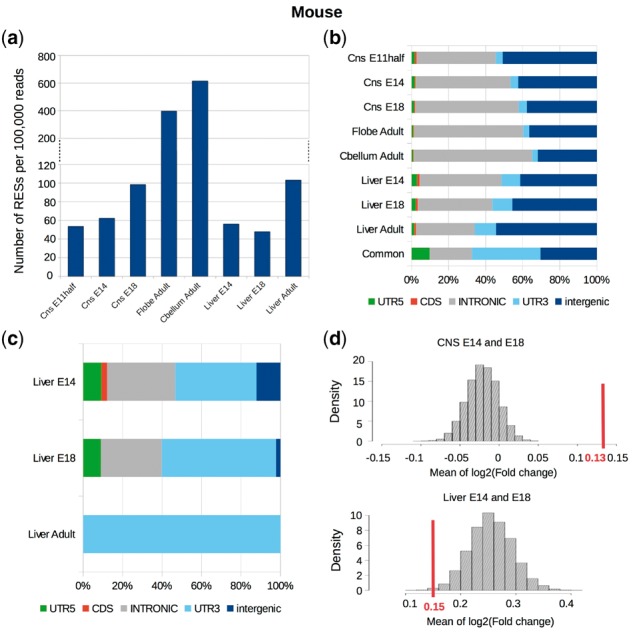
Fig. 5.

RNA editing in embryonic and adult mouse tissues. (a) The normalized number and (b) the proportions of different categories of A-to-I RESs, and (c) the proportions of different categories of C-to-U RESs in mouse embryonic and adult tissues. (d) The mean expression level change of newly edited genes during the development of embryonic CNS (upper) and liver (lower). The line segment represents the mean expression level changes [log2 (fold change)] of newly edited genes (1822 and 1139 genes in CNS and liver, respectively), while the null distributions are plotted by computing the mean expression level change of randomly selected genes (the same number as the newly edited genes) in CNS and liver (10 000 times of randomization)
