
Fig. 1.
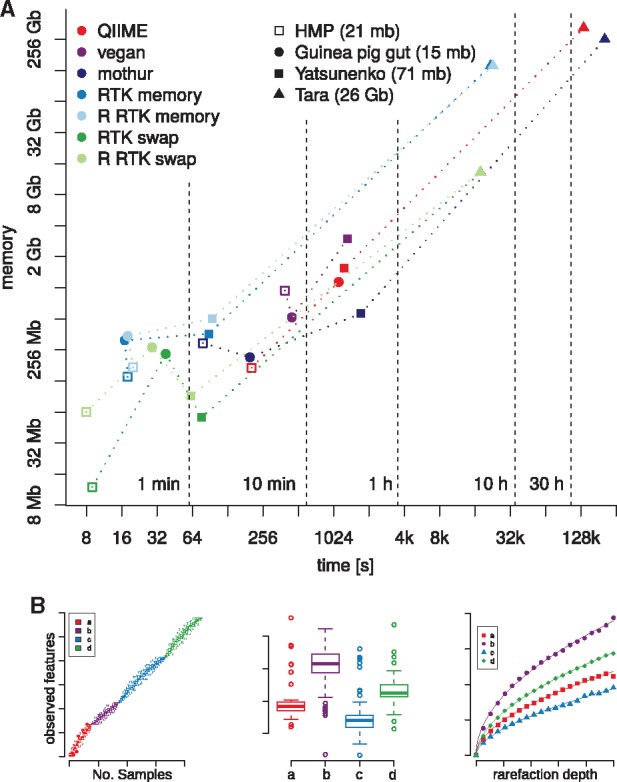
(A) Speed and memory requirements of different rarefaction programs. Four datasets were 20 times rarefied at 95% lowest sample count. Time and memory consumption of our implementation is consistently below that observed using mothur, vegan or QIIME for the same purpose. vegan failed processing the Tara table (see Supplementary material). (B) Plotting of collector curves as well as of rarefaction curves is implemented in the R-package (Color version of this figure is available at Bioinformatics online.)