Fig. 2.

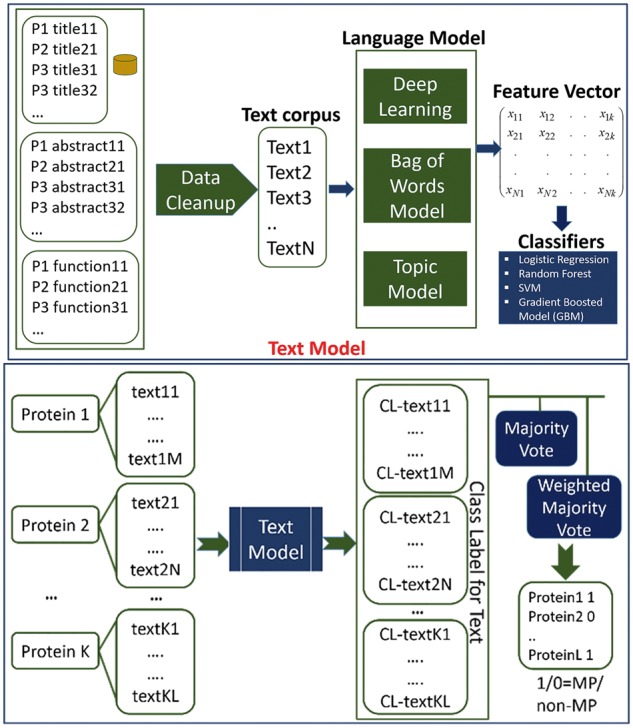
Schematic diagram of DextMP. The upper panel shows the text prediction process while the bottom panel is for the prediction model that uses predicted text labels to make the final MP/non-MP classification. P1, Protein 1, CL: Class Label

Schematic diagram of DextMP. The upper panel shows the text prediction process while the bottom panel is for the prediction model that uses predicted text labels to make the final MP/non-MP classification. P1, Protein 1, CL: Class Label