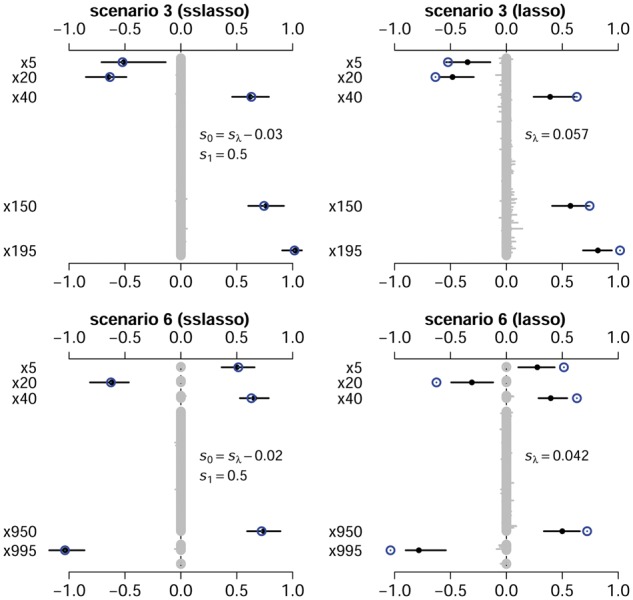
Fig. 2.

The parameter estimation averaged over 50 replicates for the spike-and-slab lasso Cox model and the lasso Cox model. The numbers of simulated predictors are m = 200 for scenario 3 and m = 1000 for scenario 6. The cycles are the assumed true values. The black points and lines represent the estimated values and the interval estimates of coefficients over 50 replicates
