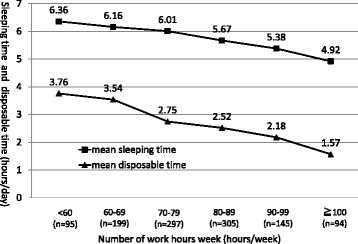
Fig. 1.

Association between the number of work hours per week and number of hours for sleep per day or amount of disposable time per day (n = 1135). ■:the mean number of hours for sleep per day ▲:the mean duration of disposable time per day. The graph shows the mean number of hours for sleep per day and the mean duration of disposable time per day at the 3 months later of first-year residency analyzed by stratifying the number of working hours per week into six groups (0–59, 60–69, 70–79, 80–89, 90–99, and ≥ 100 h)
