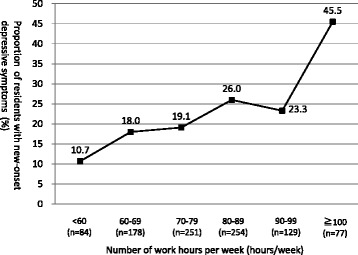
Fig. 2.

Association between the number of work hours per week and new-onset depressive symptoms (n = 973). The graph shows the proportion of new-onset depressive symptoms at the 3 months later of first-year residency analyzed by stratifying the number of working hours per week into six groups (0–59, 60–69, 70–79, 80–89, 90–99, and ≥ 100 h)
