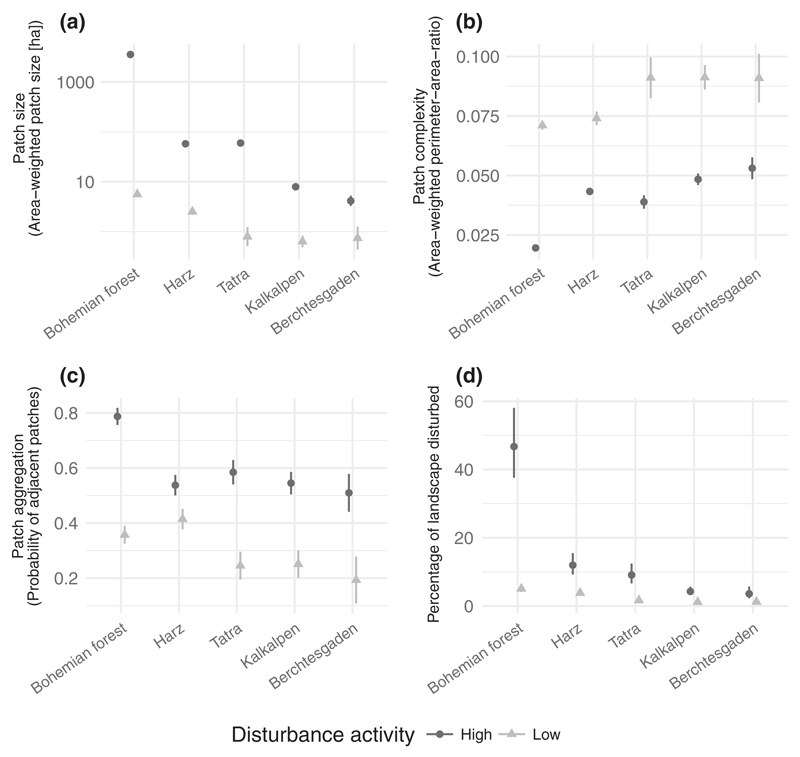
Figure 2.
Differences in landscape patterns between sites and high/low disturbance activity years. The metrics used to describe landscape pattern are (a) patch size, (b) patch complexity, (c) patch aggregation, and (d) percentage of landscape disturbed. Estimates show the mean and standard error obtained from the LM/GLM model and—for the landscape metrics (Probability of adjacent patches and Percentage of landscape disturbed)—are based on 1,000 sublandscapes randomly resampled within each landscape. Landscapes are in order of increasing terrain complexity from left to right (see Section 2.1 and Fig. S1). A statistical summary of the patch/landscape metrics is given in Table S9. For details on the patch/landscape metrics, we refer the reader to Table 2. Note that for (a) the y-axis is log10-scaled

