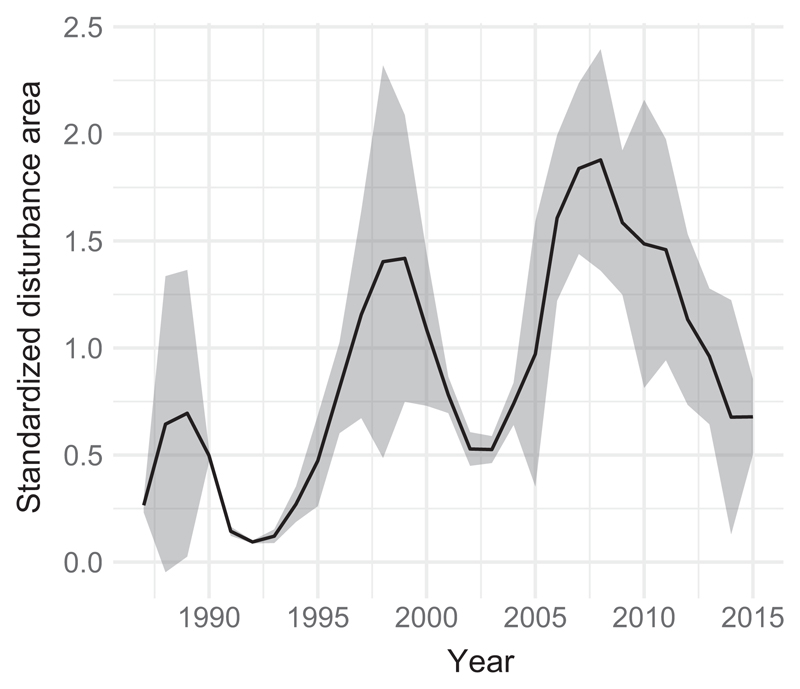
Figure 3.
Synchrony in temporal disturbance dynamics across the temperate forest biome of Europe. The values shown are the mean and standard error over the standardized disturbance time series of the five different landscapes. The y-axis is given in units of standard deviation. If there would be no temporal synchrony between landscapes, the time series would be a flat line close to one. (see also Fig. S10)

