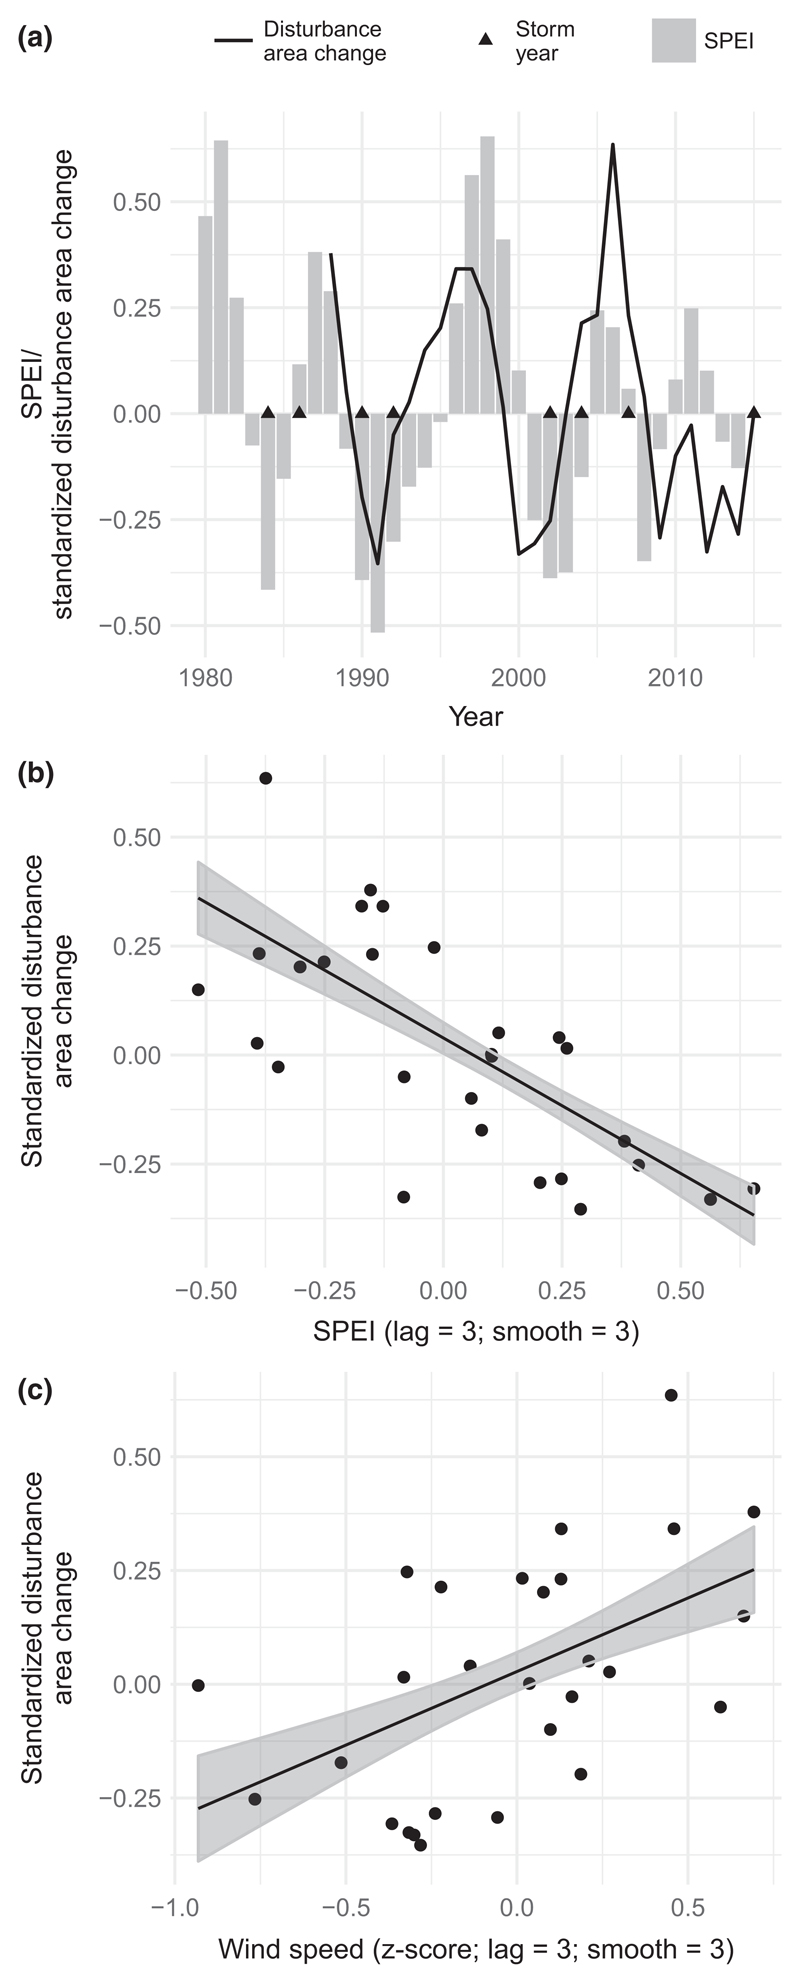
Figure 4.
(a) Temporal variability in drought and storm activity in relation to forest disturbance activity across temperate forests of Europe. Storm years are years with mean daily maximum wind speed >0.5 standard deviations above the long-term average. Low SPEI values indicate drought periods. (b) Relationship between annual drought (lag of 3 years and smoothing of 3 years) and changes in forest disturbance area as estimated from the GLS model. (c) Relationship between annual peak wind speeds (lag of 3 years and smoothing of 3 years) and changes in forest disturbance area as estimated from the GLS model

