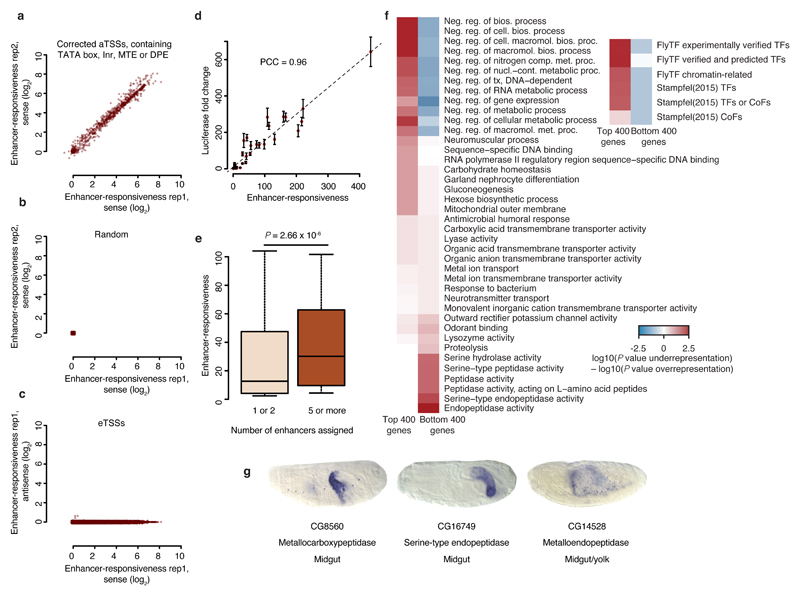
Figure 4. Wide range of enhancer responsiveness and associated biological functions.
(a–c) Scatterplots showing the range of enhancer responsiveness at corrected aTSSs that contain exclusively TATA box, Inr, MTE, or DPE in a, random positions in b, and eTSSs in c, depicting replicate 1 versus 2 in a, and b, and sense versus antisense signals of replicate 1 in c. (d) Enhancer responsiveness according to STAP-seq versus luciferase induction by the zfh1 enhancer. Error bars, s.d.; n = 3. (e) Boxplot showing enhancer responsiveness for aTSSs of genes that are surrounded by 1 or 2 versus 5 or more enhancers (n = 1,325 and 139, respectively; Wilcoxon P value). Center line: median; limits: interquartile range; whiskers: 10th and 90th percentiles. (f) Heatmaps depicting enrichments for the most differentially enriched Gene Ontology (GO) categories and for defined sets of transcription factors among the 400 genes associated with the strongest or weakest eTSSs that contain exclusively TATA box, Inr, MTE, or DPE. (g) Berkeley Drosophila Genome Project (BDGP)39 in situ embryo images for genes representing the GO categories most strongly enriched near weak eTSSs.

