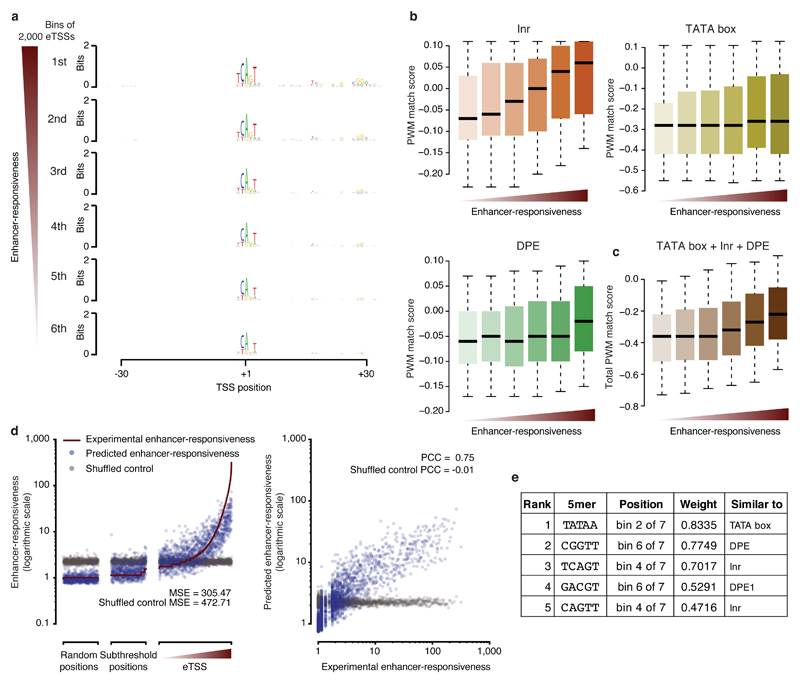
Figure 5. Candidate sequences are predictive of responsiveness to developmental enhancers.
(a) Sequence logos summarizing position-specific nucleotide frequencies for eTSSs (bins of 2,000 sequences) ranked by decreasing enhancer responsiveness. (b) Position weight matrix (PWM) match scores for TATA box, Inr, and DPE motifs at eTSSs ranked by enhancer responsiveness (b), and aggregate quality scores of all three motifs from b (c). Center line: median; limits: interquartile range; whiskers: 5th and 95th percentiles. (d) Scatterplots of experimentally determined and predicted enhancer responsiveness for eTSSs, subthreshold positions, and random positions. Also included is predicted enhancer responsiveness after randomizing the assignment between the sequences and responsiveness (gray). MSE: mean square error. (e) Five most predictive 5mers, their positions (bin out of 7 bins along the sequence), and weights, as well as the most similar known core promoter motifs.

