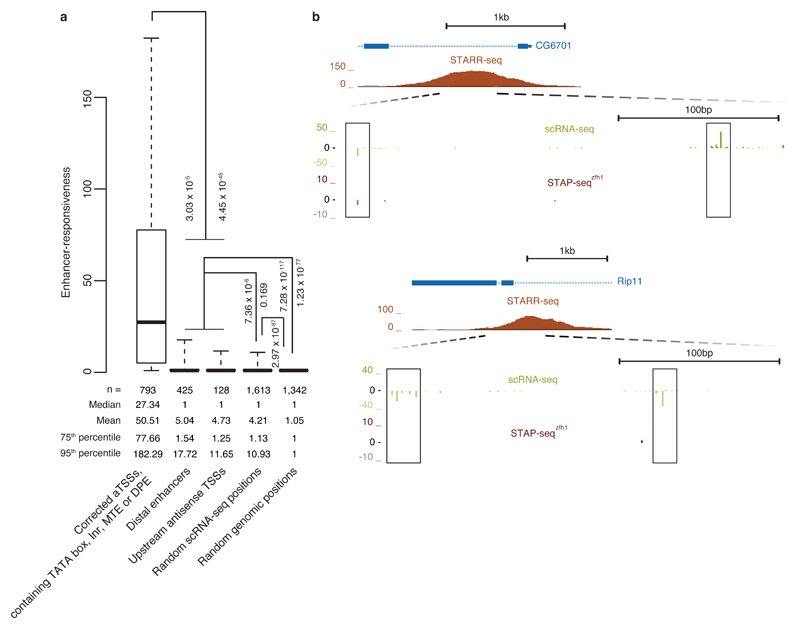
Figure 6. Positions of endogenous transcription initiation in developmental enhancers and upstream of aTSSs have weak sequence-intrinsic enhancer responsiveness.
(a) Boxplot depicting enhancer responsiveness of positions that initiate transcription in S2 cells (≥5 scRNA-seq18 tags; left-most four boxes) or are randomly selected from the D. melanogaster genome (rightmost box, ‘Random genomic positions’). ‘Corrected aTSSs, containing TATA box, Inr, MTE or DPE’, are position-corrected according to scRNA-seq18 as in Fig. 4a and Supplementary Fig. 6b. For ‘Distal enhancers’, we used STARR-seq enhancers14 that are more than 500 bp away from the nearest aTSS and for each enhancer considered the position with the highest scRNA-seq signal within ± 250 bp around the STARR-seq peak summit on either strand (disregarding enhancers for which this signal was below 5 tags). For ‘Upstream antisense TSSs’, we considered the position with the highest scRNA-seq signal upstream and antisense of aTSSs until the 3′end or—for divergent gene pairs—until 500 bp upstream of the 5′end (aTSS) of the next gene. ‘Random scRNA-seq positions’ are aTSS- and enhancer-distal and not closely spaced with respect to each other. Also shown are P values via one-sided Wilcoxon’s rank-sum test between the categories. Center line: median; limits: interquartile range; whiskers: 5th and 95th percentiles. (b) UCSC Genome browser screenshots exemplifying representative loci of endogenous transcription initiation within enhancers as measured by scRNA-seq18 that have only weak STAP-seq signals.

