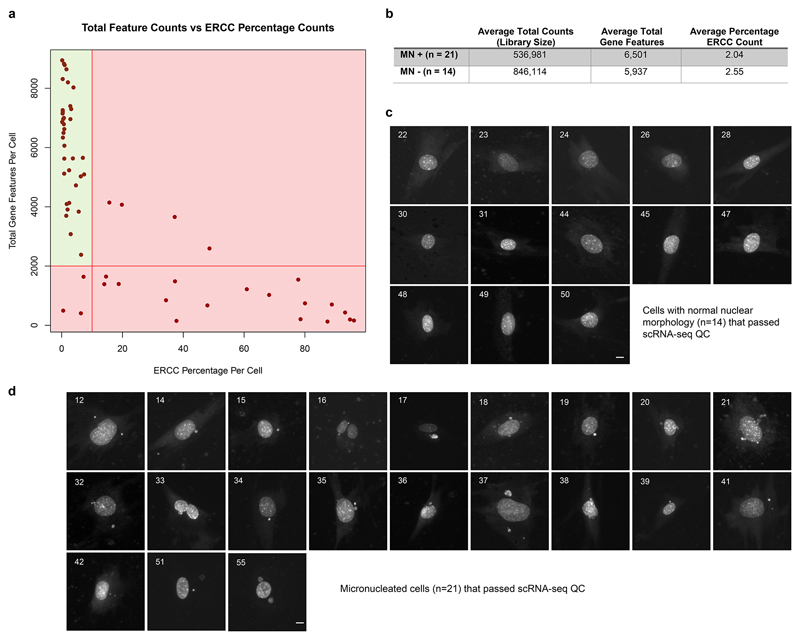
Extended Data Fig 9. scRNA-seq QC and microscopy images of the individual LCM captured cells.
(a) Total gene feature counts (reads mapping to a protein coding gene) vs ERCC (RNA spike-in) percentage of total counts per cell. Cells with ERCC percentage counts >10% and/or with feature counts < 2,000 were rejected, indicated by red shaded regions. (b) Summary statistics of 21 micronucleated (MN+) cells and 14 non-micronucleated (MN-) cells that passed QC. (c, d) Microcopy images of cells captured by LCM, that passed QC after scRNA-seq. (c) 14 live cells without micronuclei and (d) 21 live cells with micronuclei were isolated from the same culture dish using laser capture microdissection, and used for single cell mRNA sequencing. DNA was stained with picogreen dsDNA stain. Cells shown are those that passed QC; numbers indicate the order in which cells were captured. Scale bars, 10 μm.

