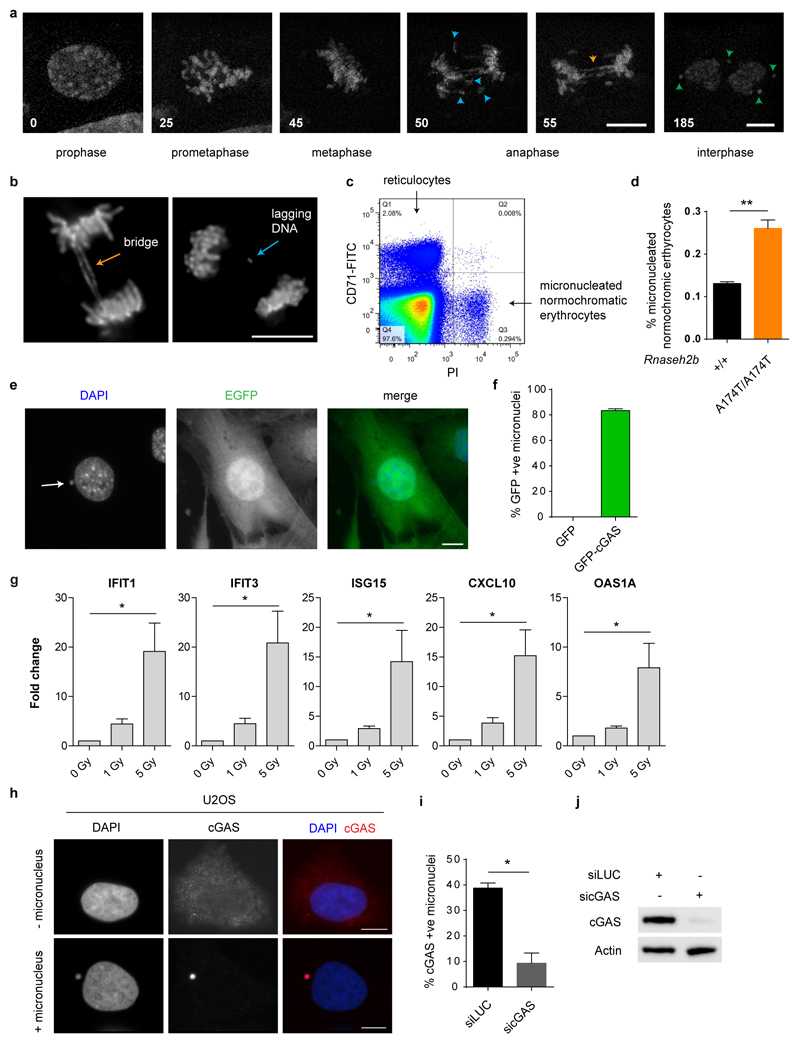
Extended data Fig 1. Micronuclei form in RNase H2 deficiency, with cGAS localising to these structures and inducing an ISG response.
(a) Still images of live imaging in Rnaseh2b-/- MEFs, time in minutes; t=0, prophase. Lagging DNA (blue arrowheads) and DNA bridges (orange) at anaphase can result in interphase micronuclei (green). (b) Chromatin bridges and lagging chromosomal DNA (indicated by arrows) occur in Rnaseh2b-/- MEFs. Representative fixed cell images. (c, d) Erythrocyte micronuclei assay37 (c) Representative FACS plot with quadrants containing reticulocytes and micronucleated normochromatic erythrocytes indicated. (d) Rnaseh2bA174T/A174T mice have a significantly increased frequency of micronucleated erythrocytes. Mean ± SEM, n=3 mice per group; two-tailed t-test, ** = P<0.01. (e, f) EGFP does not accumulate in micronuclei, whereas the majority of micronuclei show strong accumulation of GFP-cGAS. (e) Representative image of micronucleus containing Rnaseh2b-/- MEF stably expressing EGFP. (f) Quantification of GFP positive micronuclei for GFP-cGAS and GFP expressing Rnaseh2b-/- MEF lines. Mean ± SEM, n=4 experiments (≥500 cells counted per experiment). Scale bars, 10 µm. (g) Increased levels of ISG transcripts, IFIT1, IFIT3, ISG15, CXCL10 and OAS1A, were detected in C57Bl/6 (p53+/+) MEFs 48 h after IR (1 Gy). Transcript levels were normalised to HPRT. Mean ± SEM, n=3 independent experiments. One-way ANOVA, 2 degrees of freedom, * = P<0.05 (h) Endogenous cytosolic cGAS accumulates in micronuclei in U2OS cells. Representative images of cGAS distribution in cells with or without micronuclei. Images taken using different exposure times (200 vs 700 ms) to visualise weaker cytosolic cGAS signal. (i, j) Verification of anti-cGAS antibody specificity in human cells. (i) The percentage of cGAS positive micronuclei, using anti-cGAS immunofluorescence, was determined microscopically after cGAS or luciferase siRNA knockdown. Mean ± SEM, n=2 experiments (500 cells counted per experiment); two-tailed t-test. While several commercial cGAS antibodies were assessed, specific detection of mouse cGAS by immunofluorescence was not possible with these reagents (data not shown). (j) Immunoblot after siRNA knockdown of cGAS in U2OS cells. siRNA targeting luciferase (siLUC) was used as a negative control. Probing with anti-actin antibody shows equal loading.

