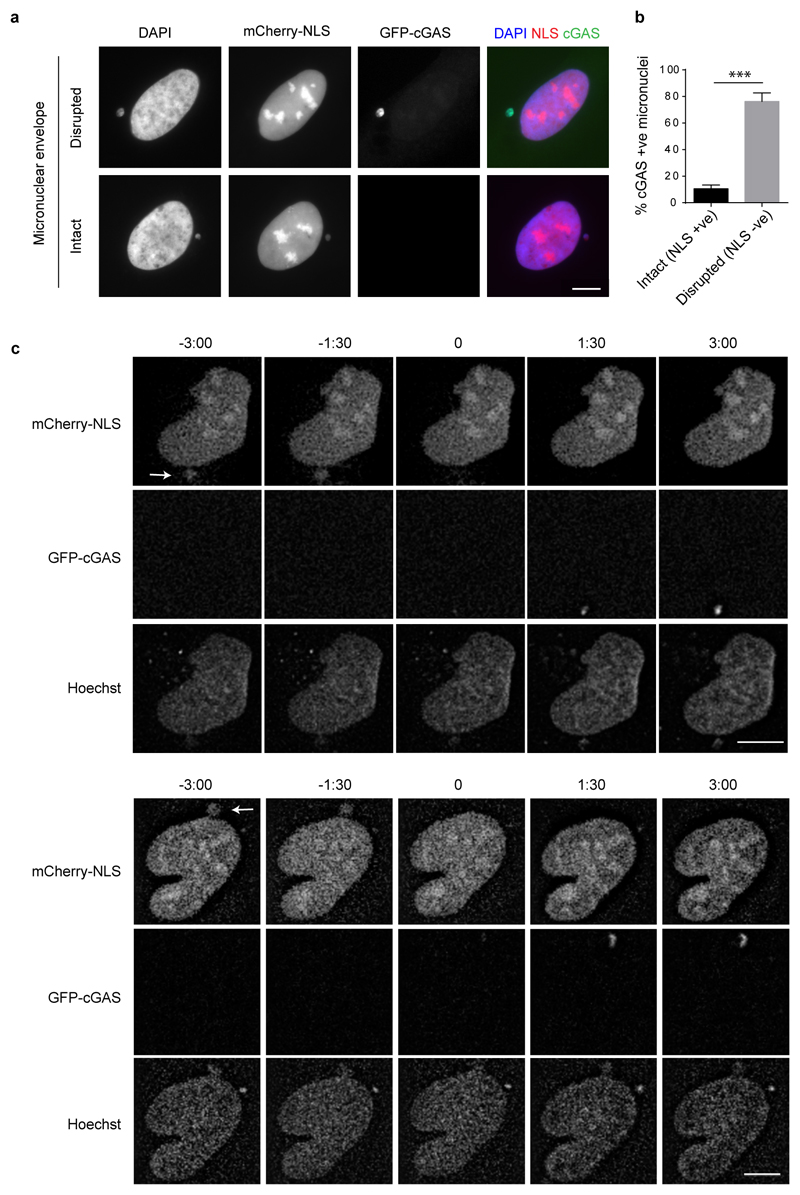
Extended data Fig 3. cGAS localises to micronuclei upon nuclear envelope rupture.
(a, b) cGAS localisation to micronuclei in U2OS cells inversely correlates with localisation of mCherry-NLS, the latter present only in micronuclei with an intact nuclear envelope. (a) Representative images of cells containing micronuclei with disrupted or intact nuclear envelope. (b) Percentage of intact and disrupted cGAS positive micronuclei. Mean ± SEM, n=3 independent experiments (≥250 micronuclei counted per experiment). NLS +ve and NLS -ve, mCherry-NLS present in or absent from micronuclei respectively. cGAS +ve, GFP-cGAS present in micronuclei. (c) Single channel image for representative stills shown in Fig 2d from live imaging of U2OS cells expressing mCherry-NLS and GFP-cGAS. DNA visualised with Hoechst. Time (min) relative to loss of mCherry-NLS from micronucleus (t=0, micronuclear membrane rupture). Arrows indicate micronuclei undergoing rupture. Scale bars, 10 µm.

