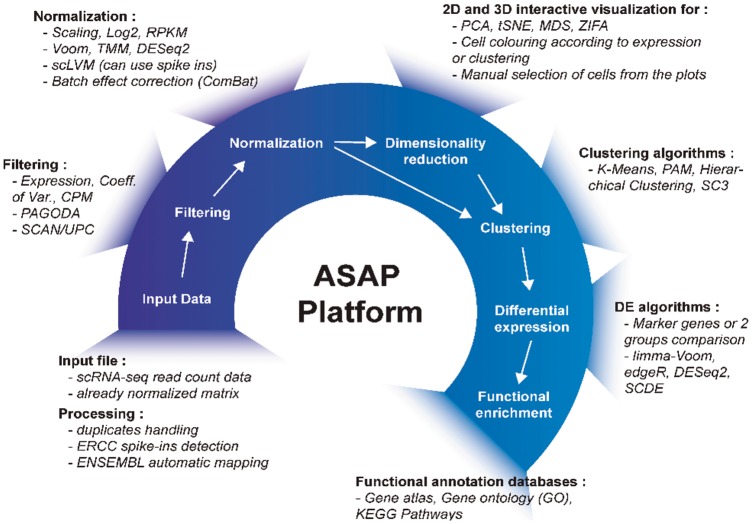
Fig. 1.
ASAP pipeline. The figure depicts the complete pipeline, including tools, that is implemented in ASAP. The user starts by uploading a count matrix (or a normalized matrix) of gene expression after which either the default pipeline or different filtering algorithms can be selected. After the normalization step, the user can apply different dimensionality reduction methods to visualize the data in 2D or 3D. The user can interactively select samples, or run clustering algorithms to perform differential gene expression analysis. Finally, the selected gene list can be analyzed for enrichment in biological modules or pathways such as the Gene Ontology or KEGG. All tools are referenced in Supplementary Table S1

