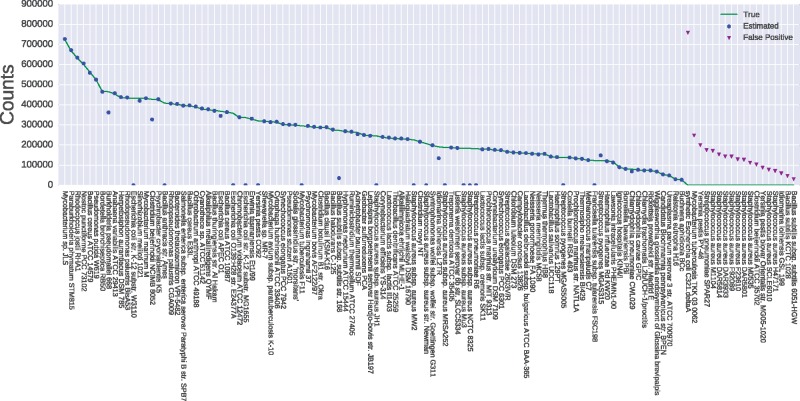
Fig. 1.
Results of kallisto on simulated reads pseudoaligned to the ensembl dataset at the exact genome level. The solid line indicates the actual counts simulated from each strain, while circle and triangle markers indicate the counts estimated by kallisto. Triangles are read counts assigned to strains that aren’t actually present in the dataset

