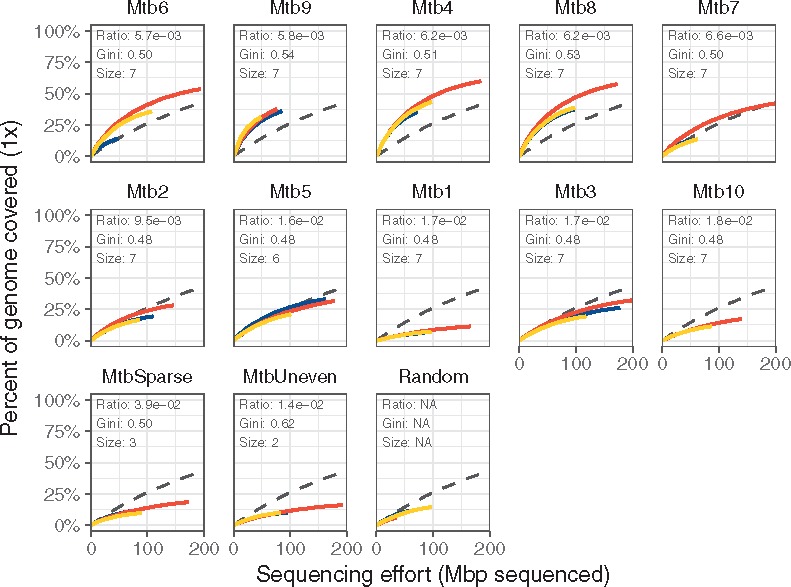
Fig. 4.

Selective amplification of Mycobacterium using swga-designed sets that prioritized primer-level evenness and set-level binding density and selectivity. Curves indicate the percent of the target covered at × 1 depth. Sets are ordered by the ratio of average distance between primer binding sites on the target to average binding distance on the background. The coloring indicates individual replicates, and the black dashed line indicates the unamplified control. The sets with the lowest ratios returned greater coverage of the target genome compared to unamplified controls than those with higher ratios, as shown by the rarefaction curves of these sets being higher than the dashed lines
