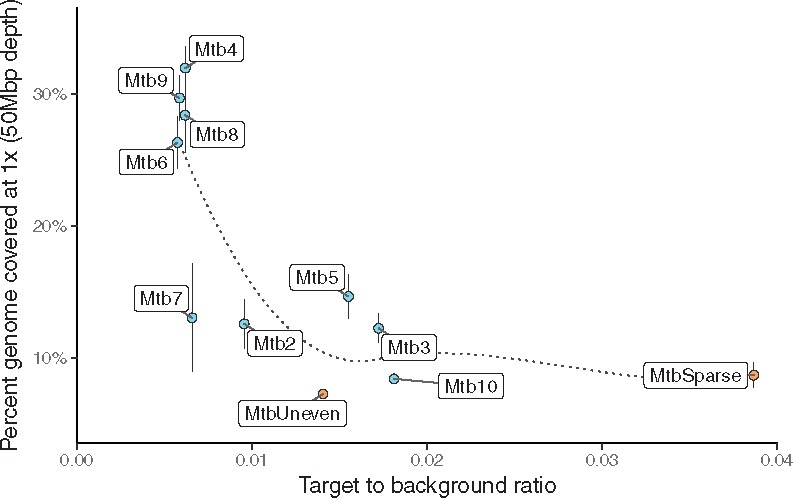
Fig. 6.

The percentage of the Mycobacterium genome covered by each set at ×1 coverage after 50 Mbp of sequencing is inversely correlated to the set’s target to background binding distance ratio (e.g. selectivity). The smoothed line of best fit (LOESS) is shown by the dotted line. The points and whiskers represent the median and standard deviation of the technical replicates. Positive tests are in blue, while negative controls are in orange. The random hexamers did not have a definable ratio and are not displayed
