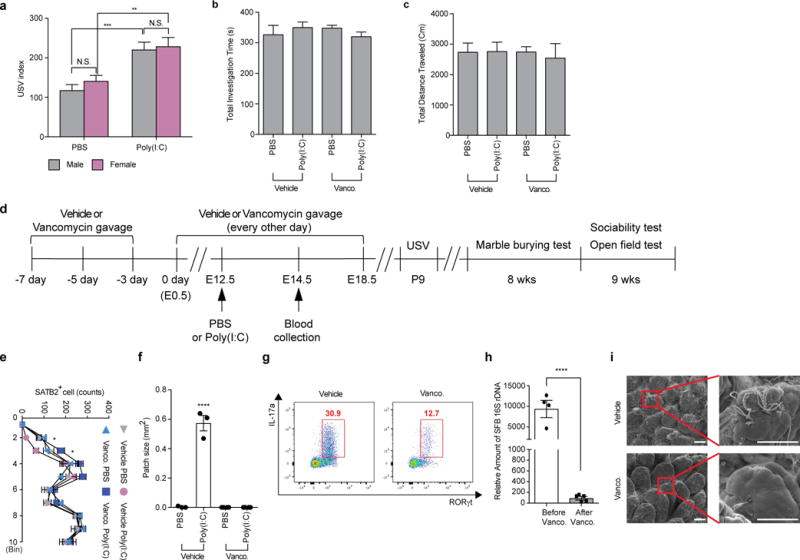
Extended Data Figure 1. Maternal vancomycin-treatment prevented induction of behavioral abnormalities in MIA offspring.

a, USV index (n=27/29 (PBS;male/female); n=28/21 (Poly(I:C);male/female); 6 independent experiments). b-c, Total investigation time (b) and total distance traveled (c) during the sociability test (n=13/15 (vehicle;PBS/poly(I:C)); n=12/16 (vancomycin;PBS/poly(I:C)); 3-4 independent experiments). d, Schematic of the experimental design. e-f, Quantification of SATB2+ cells (e) in the cortex divided into ten equal bins representing different depths of the cortex or of the cortical patch size (f) in the primary somatosensory cortex (S1) (n=3/4 (PBS;vehicle/vancomycin); n=3/4 (poly(I:C);vehicle/vancomycin); 2 independent experiments). g, Flow cytometry of CD4+ T cells (gated on TCR-β+CD4+) stained intracellularly for IL-17a and RORγt. Mononuclear cells were collected at E14.5 from the ilea of poly(I:C)-treated mice with/without vancomycin treatment; Representative FACS plot from 3 independent experiments. h, qPCR analysis measuring relative SFB levels in B6 mice before/after vancomycin treatments (n=4-5/group). i, Representative SEM images of epithelial surfaces in the ilea of the vehicle-/vancomycin-treated mice from 2 independent experiments. Scale bars, 30 μm. *p<0.05, **p<0.01, ***p<0.001, ****p<0.0001 as calculated by two-way (a,e) and one-way (b,c,f) ANOVA with Tukey post-hoc tests. N.D., not determined; N.S., not significant. Graphs indicate mean +/− s.e.m.
