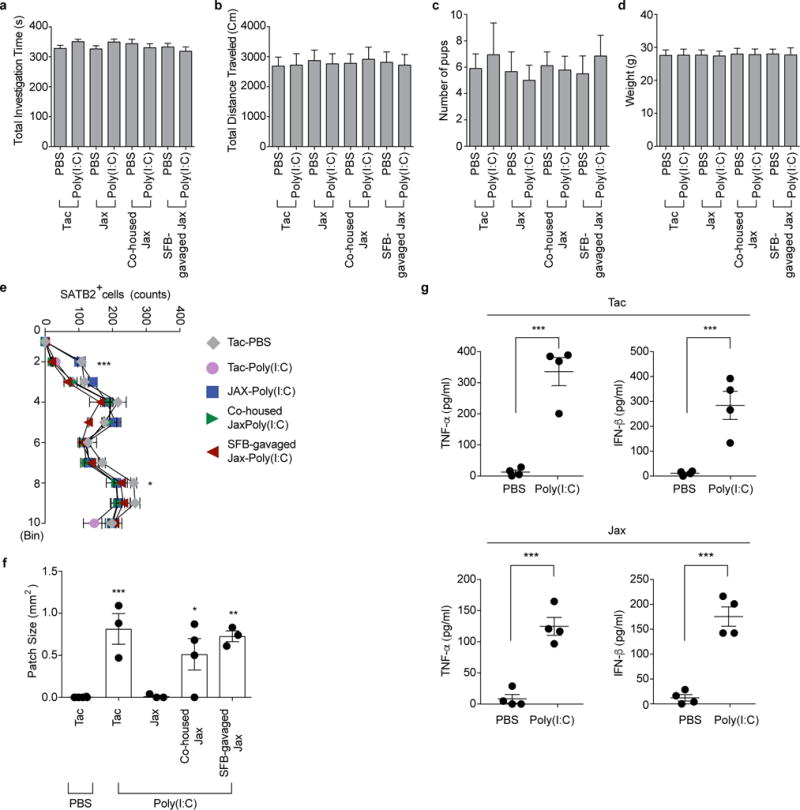
Extended Data Figure 2. MIA in SFB-absent Jax mothers does not induce changes in the total activity of the adult offspring, properties of the litter and maternal cytokine production.

a-b, Total investigation time (a) and total distance traveled (b) during the sociability test. c, Litter size upon weaning (n=59/125 (Tac;PBS/poly(I:C)); n=51/50 (Jax;PBS/poly(I:C)); n=55/81 (Co-housed Jax;PBS/poly(I:C)); n=55/89 (SFB-gavaged Jax;PBS/poly(I:C)). d, Weight of male offspring from the groups described in (c) (n=32/50 (Tac;PBS/poly(I:C)); n=29/27 (Jax;PBS/poly(I:C)); n=29/29 (Co-housed Jax;PBS/poly(I:C)); n=33/30 (SFB-gavaged Jax;PBS/poly(I:C)). Data in a, b, and d are from 7-8 independent experiments. e-f, Quantification of SATB2+ cells (e) in the cortex divided into ten equal bins representing different depth and of patch size (f) in the S1 (n=4 (Tac;PBS); n=3/3/4/3 (Tac/Jax/Co-housed Jax/SFB-gavaged Jax;poly(I:C)). g, Maternal plasma concentrations of TNF-α and IFN-β at 3 hrs after PBS/poly(I:C) injection into Tac/Jax dams at E12.5; n=4/group. *p<0.05, **p<0.01, ***p<0.001 as calculated by two-way (e) and one-way ANOVA (a-d,g,f) with Tukey post-hoc tests and Student’s t-test (g). N.D., not determined. Graphs indicate mean +/− s.e.m.
