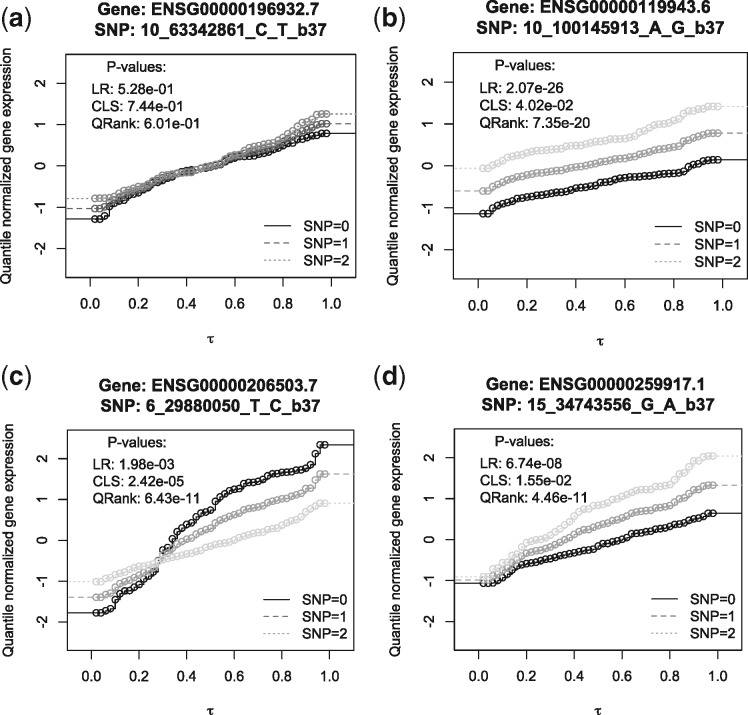
Fig. 3.
The estimated conditional distribution functions of gene expression levels for a few SNP–gene pairs in thyroid tissue. The x-axis is the grid of quantile levels , and the y-axis is the estimated conditional distribution functions for each quantile level given three SNP values and averaged covariates. This figure presents how the entire distribution of gene expression differs by SNP values for 4 SNP–gene pairs

