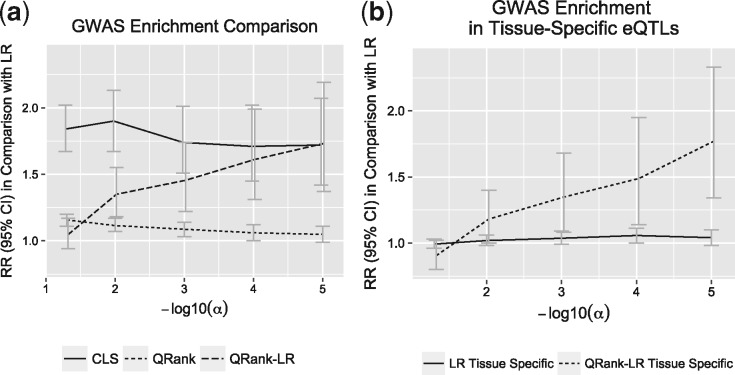
Fig. 5.
The comparison of GWAS enrichment for eQTLs identified by different approaches with FDR ranging from 0.05 to . (a) The relative risk (RR) of GWAS enrichment for CLS, QRank and QRank-LR identified eQTLs in comparison with LR identified eQTLs. (b) The RR of GWAS enrichment for LR and QRank-LR identified tissue-specific eQTLs in comparison with LR identified eQTLs (tissue-specific and non-tissue-specific)

