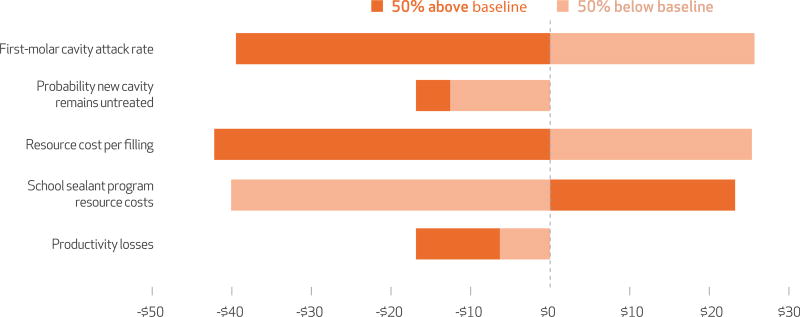
EXHIBIT 3. Effect on net cost from varying parameters between 50 percent below and 50 percent above baseline value.
SOURCE Authors’ sensitivity analysis, based on data sources in Appendix Exhibit A6. NOTE Net costs are program costs minus the averted treatment costs that resulted from fewer cavities.

