
Figure 1. ER Stress Induces Stable Remodeling of Mitochondrial Morphology through SLP2-Dependent SIMH.
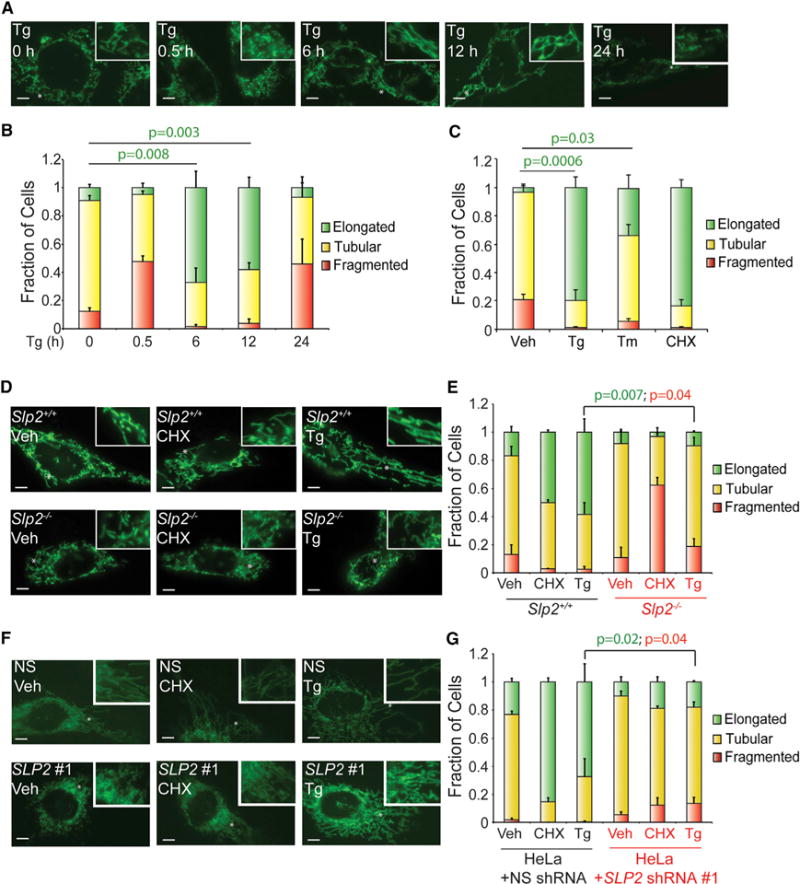
(A) Representative images of MEFmtGFP cells treated for 0, 0.5, 6, 12, or 24 hr with thapsigargin (Tg; 500 nM). The inset shows a 2-fold magnification of the image centered at the asterisk. Scale bars, 5 μm.
(B) Quantification of fragmented (red), tubular (yellow), or elongated (green) mitochondria in MEFmtGFP cells treated for 0, 0.5, 6, 12, or 24 hr with thapsigargin (Tg; 500 nM). Error bars indicate SEM from three independent experiments. p values for elongated (green text) mitochondria from a two-tailed unpaired t test are shown.
(C) Quantification of fragmented (red), tubular (yellow), or elongated (green) mitochondria in MEFmtGFP cells treated for 6 hr with thapsigargin (Tg; 500 nM), tunicamycin (Tm; 1 μM), or cycloheximide (CHX; 50 μg/mL). Error bars indicate SEM from three independent experiments. p values for elongated (green text) mitochondria from a two-tailed unpaired t test are shown.
(D) Representative images of Slp2+/+ and Slp2−/− MEF cells transiently transfected with mitochondrial-targeted GFP (mtGFP) treated for 6 hr with cycloheximide (CHX; 50 μg/mL) or Tg (500 nM). The inset shows a 2-fold magnification of the image centered at the asterisk. Scale bars, 5 μm.
(E) Graph showing the fraction of Slp2+/+ and Slp2−/− MEF cells transiently transfected with mtGFP containing fragmented (red), tubular (yellow), or elongated (green) mitochondria in cells treated for 6 hr with CHX (50 μg/mL) or Tg (500 nM). Error bars indicate SEM for three independent experiments. p values for elongated (green text) or fragmented (red text) mitochondria from a two-tailed unpaired t test are shown.
(F) Representative images of HeLa cells stably expressing non-silencing (NS) shRNA or SLP2 shRNA #1 and transfected with mtGFP. Cells were treated for 6 hr with thapsigargin Tg (500 nM) or CHX (50 μg/mL), as indicated. The inset shows a 2-fold magnification of the image centered at the asterisk. Scale bars, 5 μm.
(G) Graph showing the fraction of HeLa cells stably expressing scrambled shRNA or SLP2 shRNA #1 and transfected with mtGFP containing fragmented (red), tubular (yellow), or elongated (green) mitochondria following treatment for 6 hr with Tg (500 nM) or CHX (50 μg/mL), as indicated. Error bars indicate SEM for three independent experiments. p values for elongated (green text) or fragmented (red text) mitochondria from a two-tailed unpaired t test are shown.