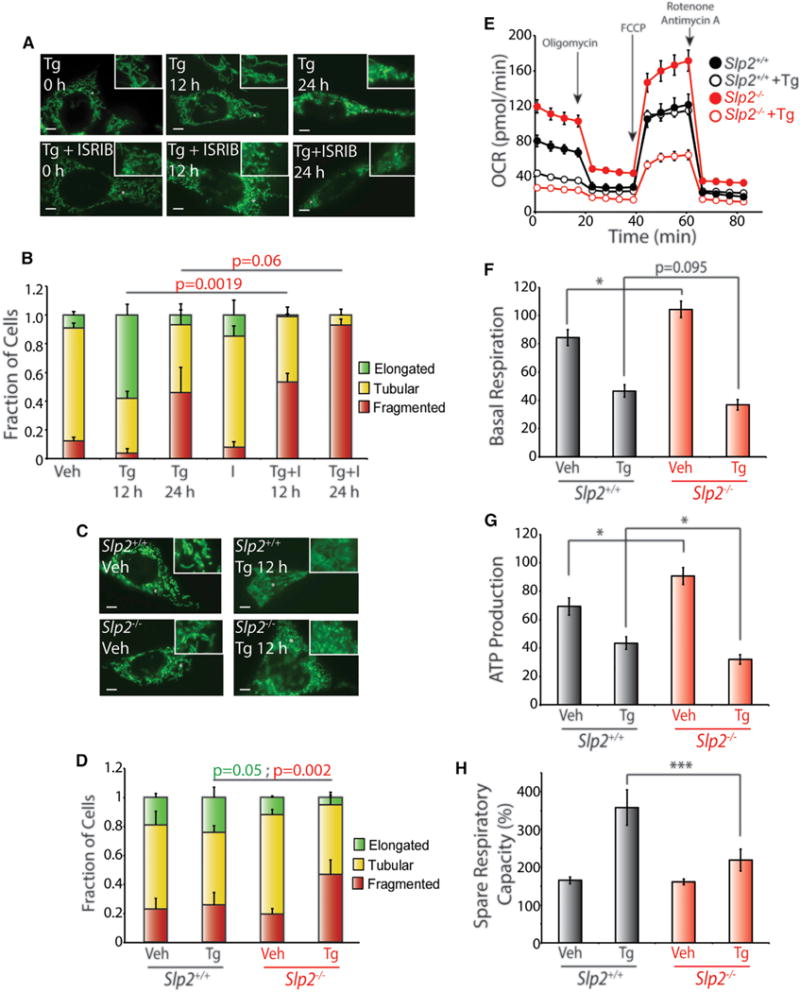
Figure 4. Pharmacologic or Genetic Inhibition of PERK-Regulated SIMH Disrupts ER-Stress-Dependent Regulation of Mitochondrial Morphology and Metabolism.

(A) Representative images of MEFmtGFP cells treated for 12 or 24 hr with thapsigargin (Tg; 500 nM) and/or ISRIB (200 nM), as indicated. The inset shows a 2-fold magnification of the image centered at the asterisk. Scale bars, 5 μm.
(B) Quantification of fragmented (red), tubular (yellow), or elongated (green) mitochondria in MEFmtGFP cells treated for 12 or 24 hr with Tg (500 nM) and/or ISRIB (200 nM). Error bars indicate SEM from three independent experiments. p values for fragmented mitochondria (red text) are shown for a one-tailed paired t test.
(C) Representative images of Slp2+/+ and Slp2−/− MEF cells transiently transfected with mitochondrial-targeted GFP treated for 12 hr with Tg (500 nM). The inset shows a 2-fold magnification of the image centered at the asterisk. Scale bars, 5 μm.
(D) Graph showing the fraction of Slp2+/+ and Slp2−/− MEF cells transiently transfected with mtGFP containing fragmented (red), tubular (yellow), or elongated (green) mitochondria in cells treated for 12 hr with Tg (500 nM). Error bars indicate SEM for three independent experiments. p values for fragmented mitochondria (red text) are shown for a two-tailed paired t test.
(E) Representative plot of oxygen consumption rates (OCRs) for Slp2+/+ and Slp2−/− MEFs pre-treated with Tg (500 nM) for 6 hr prior to analysis by Seahorse.
(F) Graph showing basal respiration for Slp2+/+ and Slp2−/− MEFs treated with Tg (500 nM) for 6 hr before OCR measurements. Error bars indicate SEM for n = 30, collected across three independent experiments. *p < 0.05 for a two-tailed unpaired t test.
(G) Graph showing ATP production of Slp2+/+ and Slp2−/− MEFs treated with Tg (500 nM) for 6 hr before OCR measurements. Error bars indicate SEM for n = 30, collected across three independent experiments. *p < 0.05 for a two-tailed unpaired t test.
(H) Graph showing spare respiratory capacity of Slp2+/+ and Slp2−/− MEFs treated with Tg (500 nM) for 6 hr before OCR measurements. Error bars indicate SEM for n = 30, collected across three independent experiments. ***p < 0.005 for a two-tailed unpaired t test.
