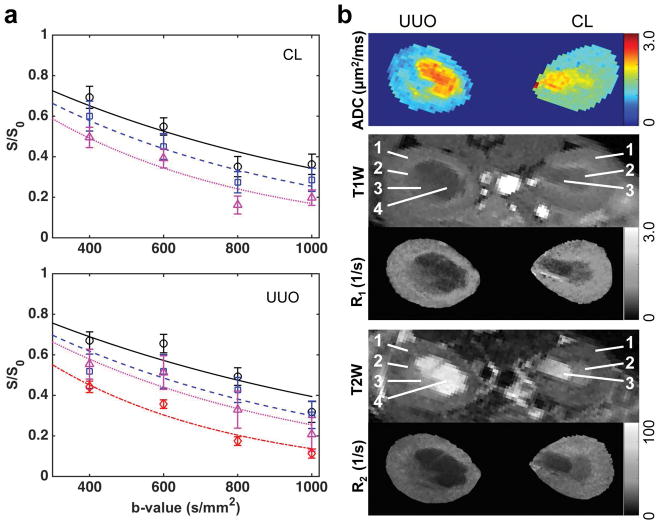
Figure 2.
Representative mapping of ADC and relaxation. (a) ADC from fitting. The regional signals of cortex, OM, IM+P, and pelvis are indicated by circles, squares, triangles, and diamonds, respectively. The curves represent the mono-exponential fitting results. Only b-values > 300 s/mm2 were used in fitting. CL-contralateral, UUO-unilateral ureter obstruction. (b) ADC, R1 and R2 maps. T1W: T1-weighted, T2W: T2-weighted. ROIs were identified in T1W and T2W images. 1-cortex, 2-OM, 3-IM+P, 4-pelvis with obstructed urine. Data were from a mouse 3 days after UUO.

