
Figure 3.
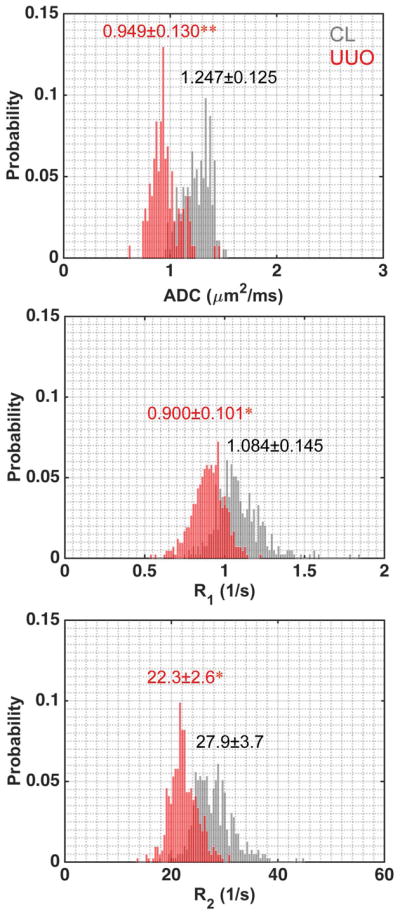
Comparison of representative cortical distributions of measured MRI parameters of CL and UUO kidneys. Cortical Mean ± SD (standard deviation) values across voxels were shown, with CL in gray and UUO in red. *p < 0.05, and **p < 0.01. Data were from a mouse 3 days after UUO.