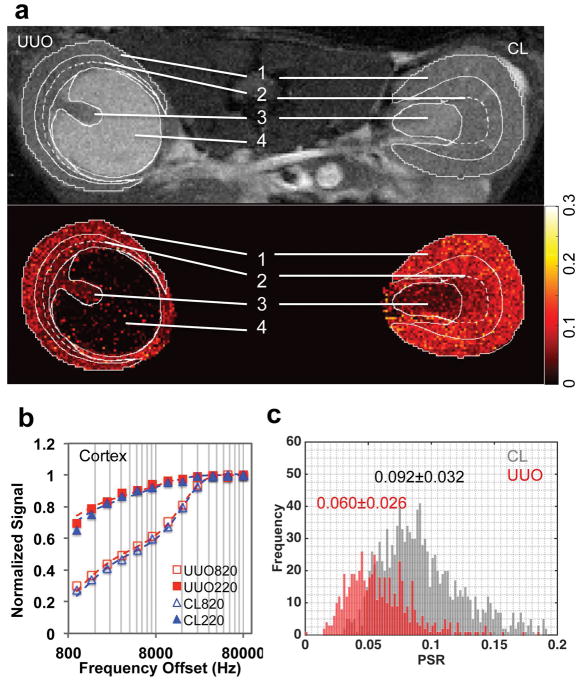
Figure 4.
QMT imaging. (a) Image with magnetization transfer contrast (MTC) and PSR map. 1-cortex, 2-OM, 3-IM+P, 4-pelvis with obstructed urine. ROIs were defined in the respective T1-weighted image, and then applied to MTC image and PSR map (solid white outlines). The contrast between OSOM and ISOM is big, indicated by the dashed white outlines. (b) The fitting of the model to in vivo MT data of cortical tissues in the CL and UUO kidneys at two flip angles of 820° and 220°. Curves were normalized to maximum intensity. (c) Cortical PSR distributions across voxels in CL (gray) and UUO (red) kidneys, with regional Mean ± SD values of PSR shown. Data were from a mouse 6 days after UUO.

