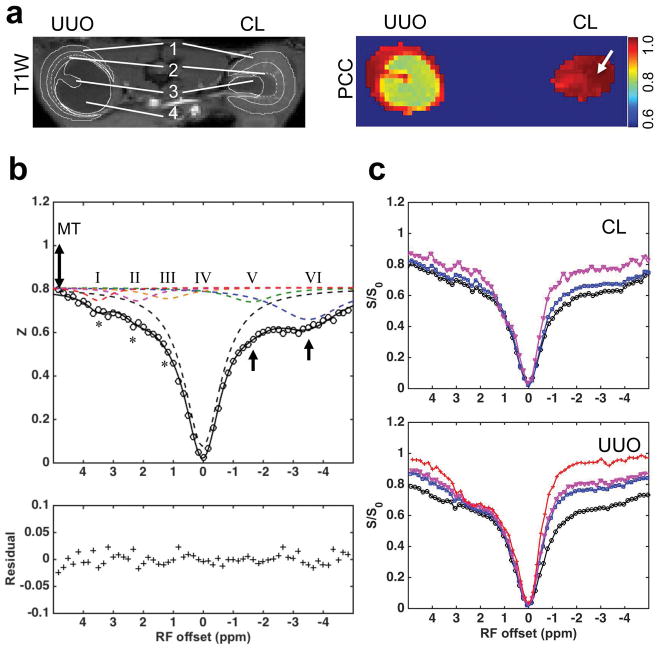
Figure 5.
Renal Z-spectroscopic features of UUO. (a) T1-weighted image and PCC map showing Pearson correlation coefficient between Z-spectra at each voxel. The averaged Z-spectrum of CL cortex was selected as the seed for correlation analysis. ROIs were defined in T1-weighted image (solid white outlines). 1-cortex, 2-OM, 3-IM+P, 4-pelvis with obstructed urine. The contrast between OSOM and ISOM is big, indicated by the dashed white outlines. (b) Characteristic spectroscopic features of normal cortical tissue. Asterisks indicate CEST effects, 1-head arrows indicate NOE effects, and 2-head arrow indicates semi-solid MT effect. Pool I, II, III, IV, V and VI were separated from 6-peak Lorentzian fitting. (c) Comparison of the regional spectra in UUO and CL kidneys. Black circles: cortex, blue squares: OM, purple triangles: IM+P, and red crosses: pelvis with obstructed urine. Data were from a mouse 6 days after UUO.

