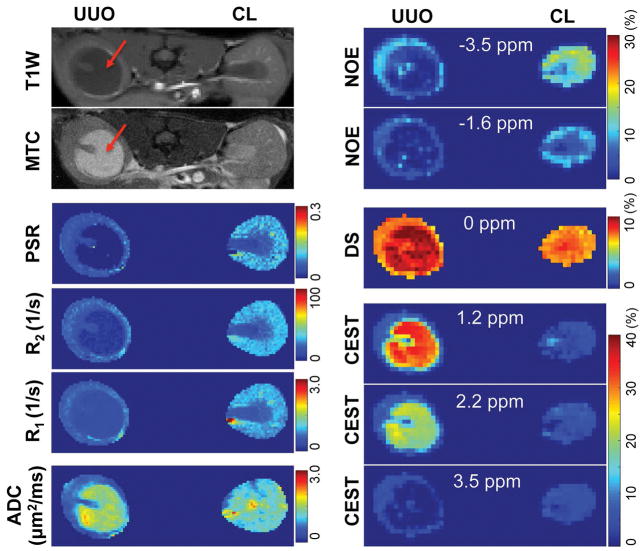
Figure 6.
Multi-parametric maps of UUO mouse on day 6 after surgery. T1-weighted (T1W) and magnetization transfer contrast (MTC) images showed hypointensity and hyperintensity respectively for the pelvis with obstructed urine in UUO kidney (red arrows). NOE, DS and CEST effects were peak amplitudes from the fitting of CEST Z-spectra. RF offsets for NOE, DS, and CEST effects were indicated.

