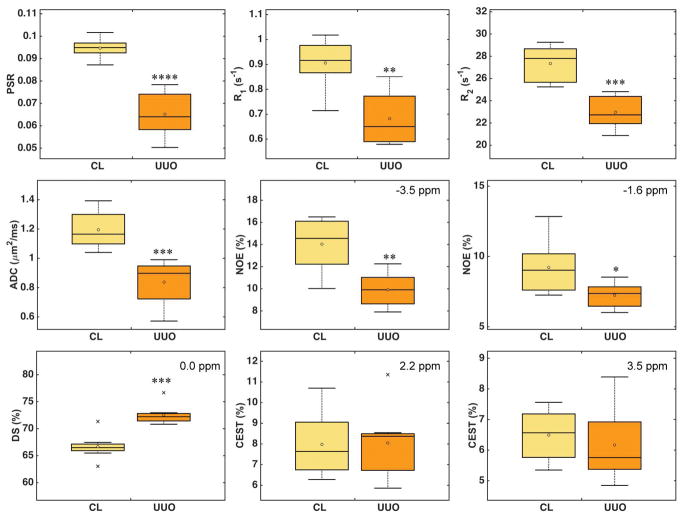
Figure 7.
Cortical MRI measures 6 days after UUO surgery. Boxplots show the comparison between CL and UUO kidneys. Middle lines indicate median and circles indicate mean values across subjects (N=8). RF offsets for NOE, DS, and CEST effects were indicated. *p < 0.05, **p < 5x10⁻³, ***p < 5x10⁻⁴, and ****p < 5x10⁻⁵ vs. CL measures.

