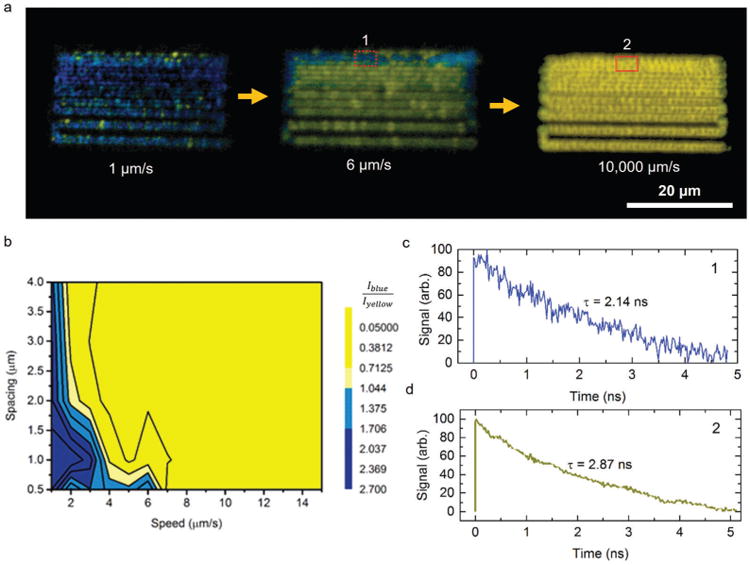
Fig. 3.

Effects of stage speed and line spacing on the emission characteristics of the printed QDs on the plasmonic substrates: (a) Merged fluorescence images of patterns of yellow QDs printed with various stage speeds and line spacing. For each pattern, the line spacing decreases from 4 μm to 0.5 μm (from bottom to top). The blue shifts occur at lower stage speeds and smaller line spacing. (b) A contour plot of the ratio of the peak intensities for the blue (450–495 nm) and yellow (560–595 nm) light as a function of stage speed and line spacing. (c and d) Fluorescence lifetime of the printed QD at the region marked as 1 and 2 in (a). The lifetime decreases at smaller line spacing and slower stage speeds.
