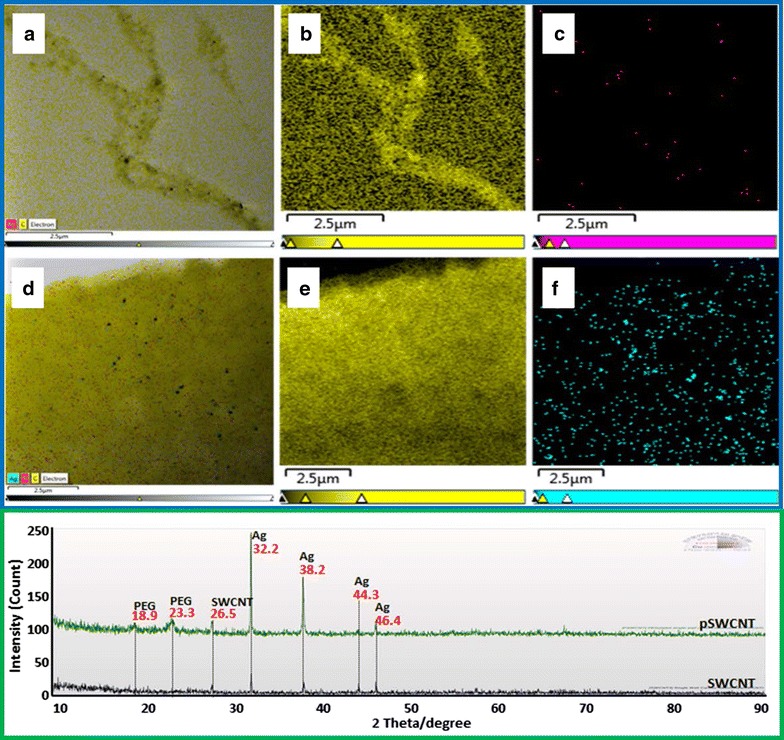
Fig. 1.

Energy dispersive X-ray spectroscopy (EDS) and X-ray diffraction (XRD) pattern analysis of pSWCNT-Ag and SWCNT-Ag. The upper panel (blue box) shows EDS mapping analysis of SWCNT-Ag (a–c) and pSWCNT-Ag (d–f). Micrographs a, d are merged images of carbon (b, e) and silver (c, f) atoms. The lower panel (green box) represents the XRD patterns depicting the presence of silver atoms (Ag) in both nanocomposites, and polyethylene glycol or PL-PEG 5000-amine (PEG) in pSWCNTs
