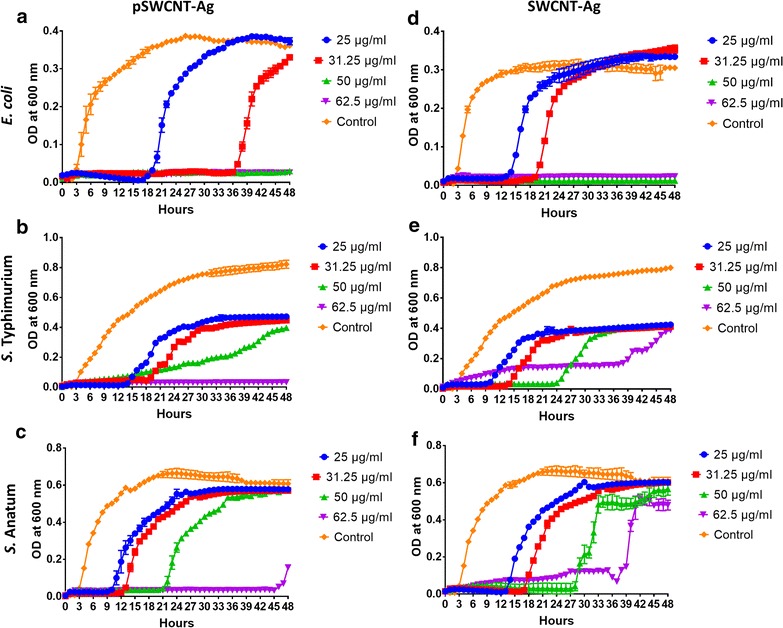
Fig. 2.

Effects of SWCNT-Ag and pSWCNT-Ag on bacterial growth. The graphs show optical density measurements (600 nm) of bacteria growth over 48-h exposure to various concentrations of pSWCNT-Ag (a–c) and SWCNT-Ag (d–f). Data are mean ± SD of three independent cultures of E. coli (a, d), S. Typhimurium (b, e) and S. Anatum (c, f)
