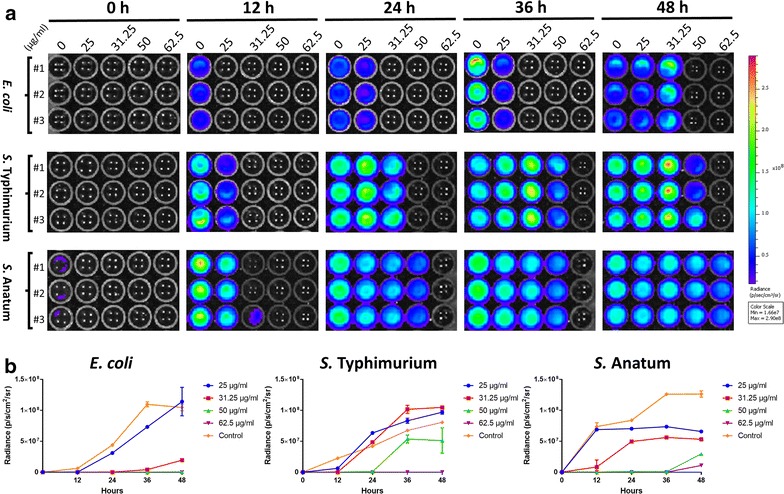
Fig. 3.

Real-time bioluminescence imaging of bacteria growth. Bioluminescence emission was imaged (a) and quantified (b) at 0, 12, 24, 36 and 48 h of culture. Bacteria (E. coli, S. Typhimurium and S. Anatum) exposed to SWCNT-Ag or pSWCNT-Ag showed similar patterns. Therefore, a representative culture plate containing bioluminescence-emitting bacteria under pSWCNT-Ag exposure is shown (a). Bioluminescence intensities (radiance) were plotted to generate the corresponding growth curves (b). Data (radiance) are mean ± SD of three independent cultures, with each bacteria strain plated in triplicate (#1, #2, and #3) per culture. The pseudo-color code scaling bar indicates the lowest (blue; 0.166 × 10⁸) to the highest (red; 2.9 × 10⁸) radiance
