Fig. 6.

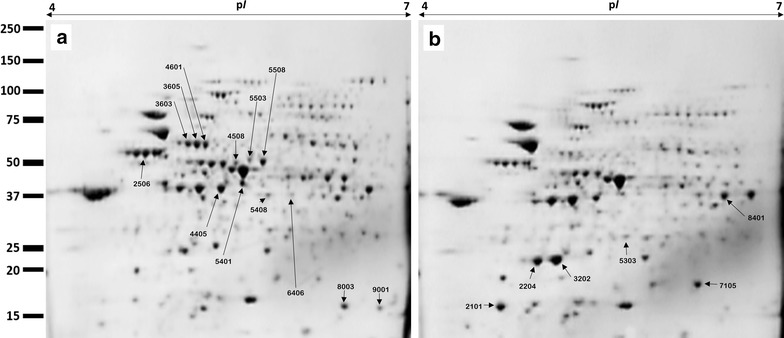
Representative two-dimensional electrophoresis gels of control (a) and pSWCNT-Ag-exposed (b) S. Typhimurium. Down- and up-regulated protein spots are shown in (a) and (b), respectively

Representative two-dimensional electrophoresis gels of control (a) and pSWCNT-Ag-exposed (b) S. Typhimurium. Down- and up-regulated protein spots are shown in (a) and (b), respectively