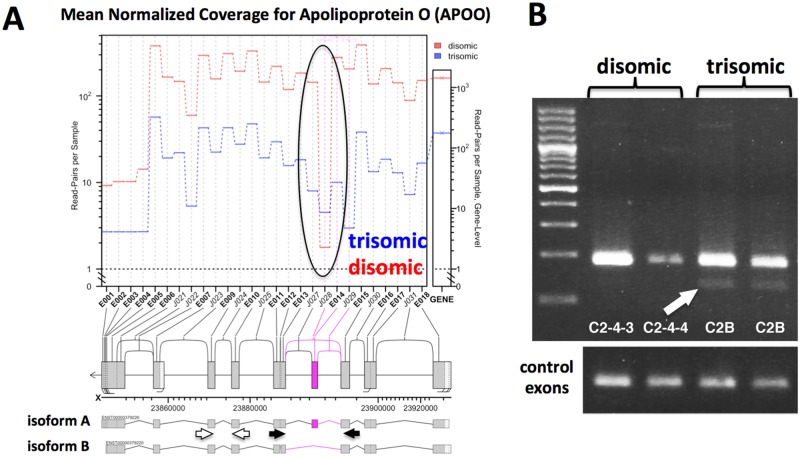
Fig 6. Altered splicing pattern of APOO in trisomic cells.
A. JunctionSeq output supporting the skipping of exon 4 in trisomic iPSCs. Black arrows indicate primers designed to amplify alternatively spliced exon; white arrows indicate control exons 6 and 7. B. RT-PCR targeting exon 4 exclusion. Arrow indicates exon exclusion band (band "B") only recovered in trisomic cells. Quantitative RT-PCR was used to show that the included exon is ~ 10 fold enriched in the trisomic samples relative to the unchanged control exons (C2B: C243, 12.7 +/- 1.3 SEM fold, C2B:C244, 9.4 +/- 1.6 SEM fold).

