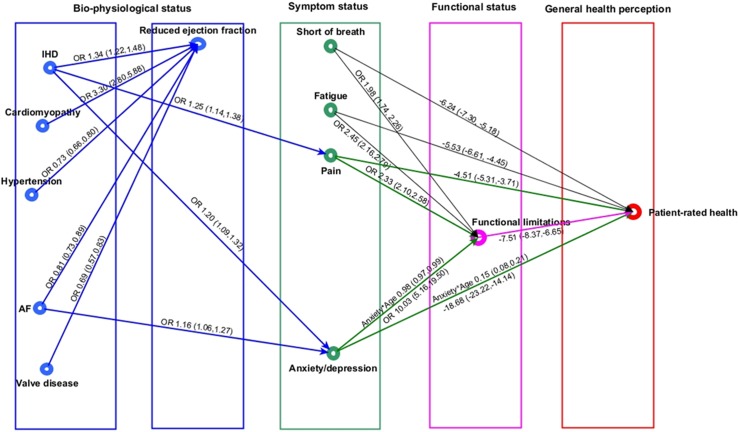
Fig 5. Cardiovascular comorbidities in heart failure and patient health pathway.
In the regression graph an arrow is present between a response and an explanatory variable if there is a significant association (P < 0.01), controlling for all remaining regressors. The strength of this association is shown as OR (95% CI), if the response variable is binary, and mean difference (95% CI) in the response variable for a 1-unit increase in the explanatory variable, if the response variable is continuous. Significant interactions and non-linear relationships are also indicated. Reduced ejection fraction defined as <40%. Pain and anxiety or depression defined as ‘any problems’. Shortness of breath and fatigue defined as ‘marked or severe’, and functional limitation as ‘any’ limitation in usual activities. Patient-rated health was measured by EuroQol visual analogue scale, ranging from 0 (worst health imaginable) to 100 (best health imaginable). AF, atrial fibrillation; IHD, ischemic heart disease; OR, odds ratio.

