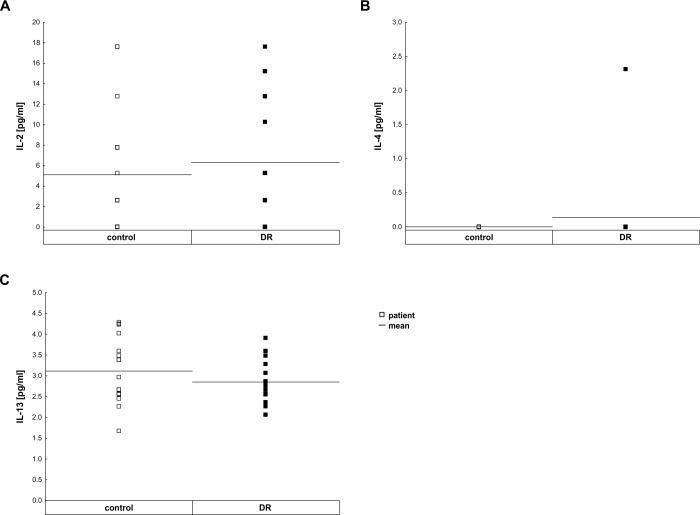
Fig 2. Contribution of pleiotropic immunomodulatory cytokine levels in vitreous samples.
A. A difference in IL-2 (p = 0.62) level was not measurable between control and DR patients. B. There was no difference in IL-4 level between control and DR patients (p = 0.78). C. A trend for the down-regulation of IL-13 level (p = 0.36) was noted in DR patients. Each symbol depicts an individual patient. The horizontal bar indicates the mean cytokine concentration per group.

