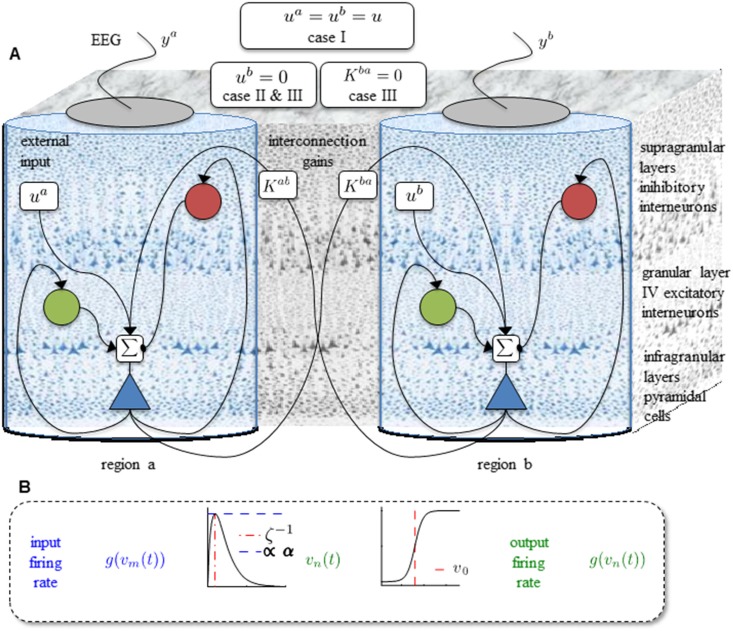
Fig 1. The schematic diagram of network of Jansen’s model and three underlying cases.
A. The schematic diagram of the neural mass model for two cortical regions described by Eq 4. B. Elements of a neural mass, showing the synaptic kernel on the left and the sigmoidal nonlinearity on the right.

