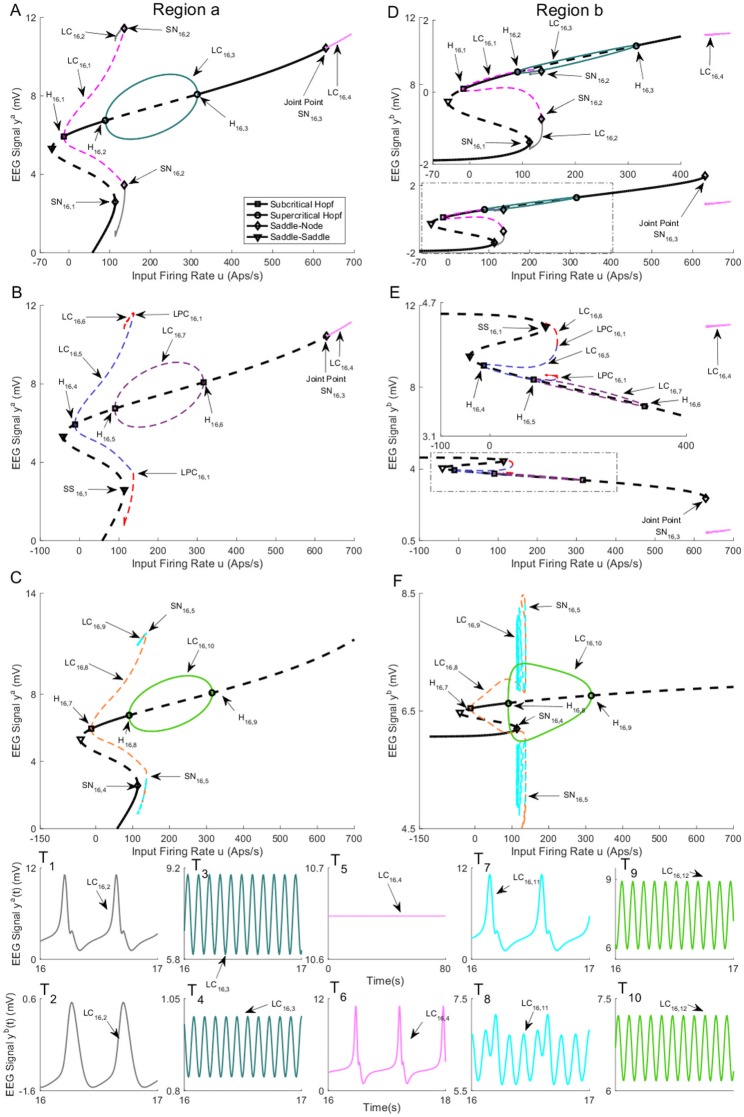
Fig 16. Bifurcation diagrams for case III with coupling gain K = 250.
A), B), and C) are the first, second, and the third branches of equilibria for region a. D), E), and F) are the first, second, and the third branches of equilibria for region b. Panels T1-T10) show the EEG time series corresponding to the each part in the bifurcation diagrams. The solid black lines show stable fixed points, the solid colored lines show stable oscillatory behavior and the dashed lines show unstable fixed points and unstable oscillations. The initial conditions and the corresponding values of the input u for all times series are provided in Appendix B.

