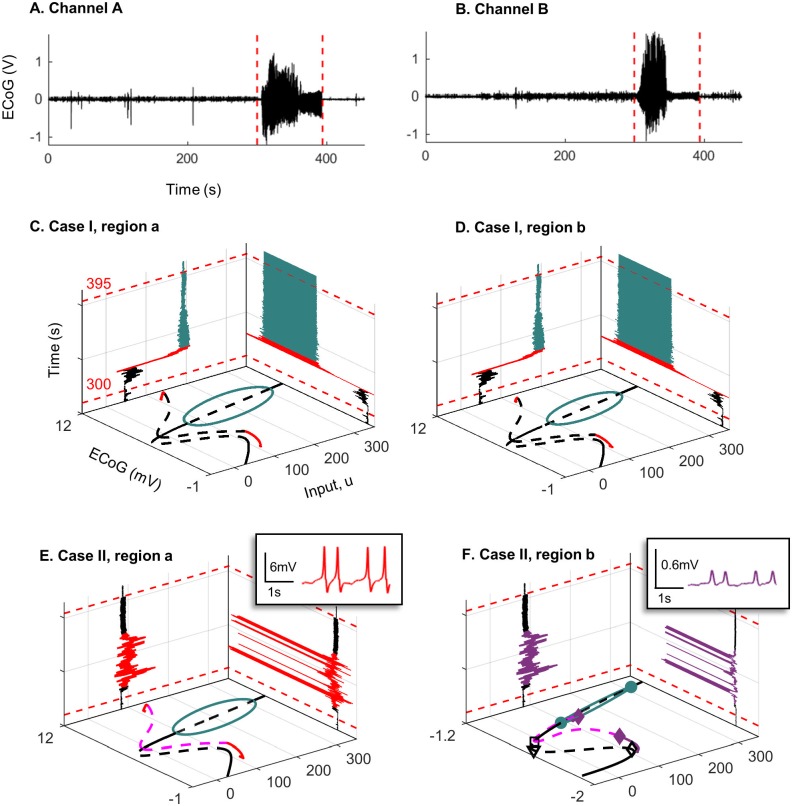
Fig 18. Recorded ECoG from two channels for seizure two and the bifurcation diagrams.
Panels A) and B) are ECoG recordings of the same seizure (seizure two) on two different electrode channels. Recording was taken five minutes prior to seizure onset (red dashed line) and continued for 1 minute after offset (red dashed line). C) and D) show the bifurcation diagrams corresponding to case I, estimated input parameter u during the seizure (left wall panel), and the output ECoG after forward simulation based on the estimated input (right wall panel). Note that the plot only shows estimation from 10s before seizure onset to 10s after seizure offset. E) and F) show the same plots as C) and D) but correspond to case II of the coupled neural mass model. Insets show the different waveforms (color-coded) that were found during forward simulation (right wall panel).

