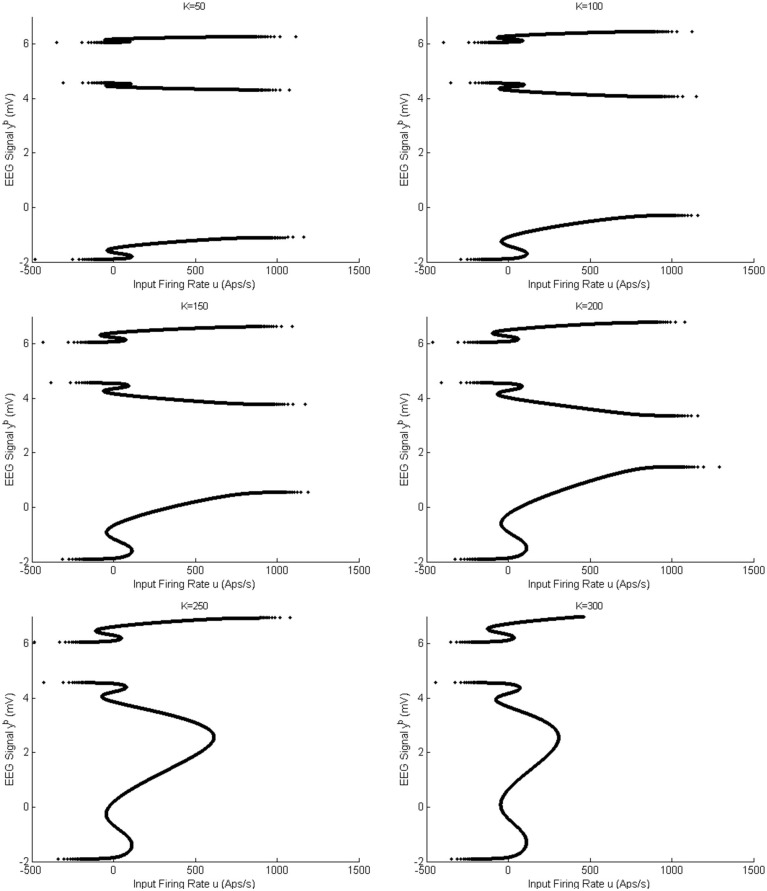
Fig 21. Equilibria of second region for case II and for different values of coupling gain K.
In this figure, solid black lines show the equilibria regardless of their stability or instability. The three branches of equilibria for K = 50 are labeled according to Fig 9. The saddle-node for K = 250 is labeled according to Fig 12.

