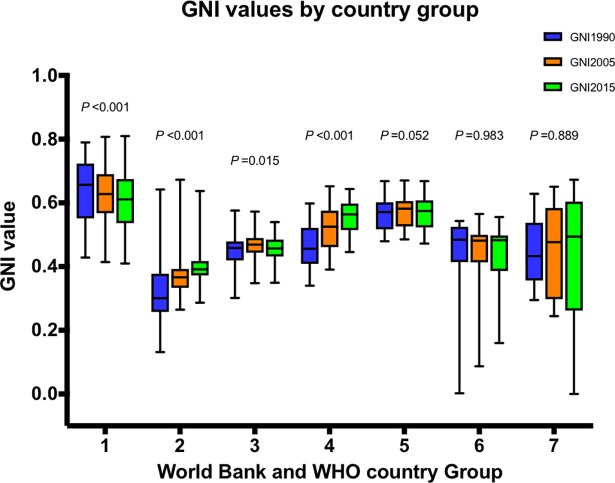
Fig 2. Box-whisker plots of GNI by World Bank and WHO group for 1990, 2005 and 2015.
Groups—1, High-income countries (n = 52); 2, African low-and middle-income countries (LMIC) (n = 45); 3, American LMIC (n = 26); 4, South-East Asian LMIC (n = 11); 5, European LMIC (n = 20); 6, Eastern Mediterranean LMIC (n = 16); 7, Western Pacific LMIC (n = 16). Thick line in the box—median; upper- and lower- borders of box—75% and 25% percentile; whiskers—maximum and minimum. In group 6 and 7, because some country has one of the maximum values of the three indicators, the GNI of which appears to be zero when calculated by the geometric mean. P values are derived from Friedman’s Exact test.

