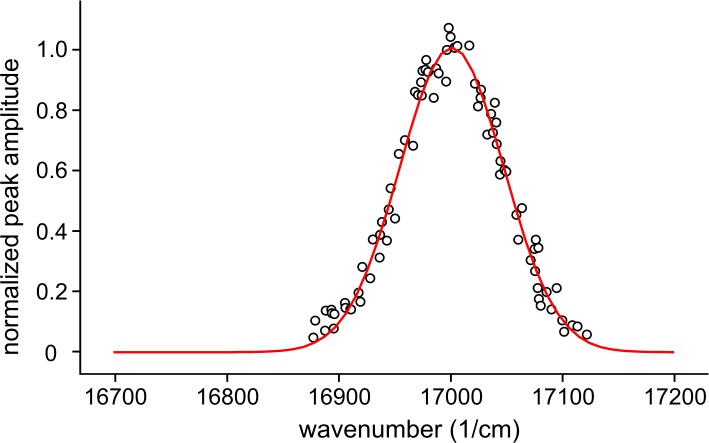
Fig 5. Determination of inhomogeneous distribution function (IDF).
Normalized amplitudes of the peaks determined from fluorescence line narrowing (FLN) spectra of β-Zn-HbA after a background correction as a function of their center in the 16875–17125 cm-1 wavenumber range with a fitted Gaussian as an inhomogeneous distribution function (IDF).

